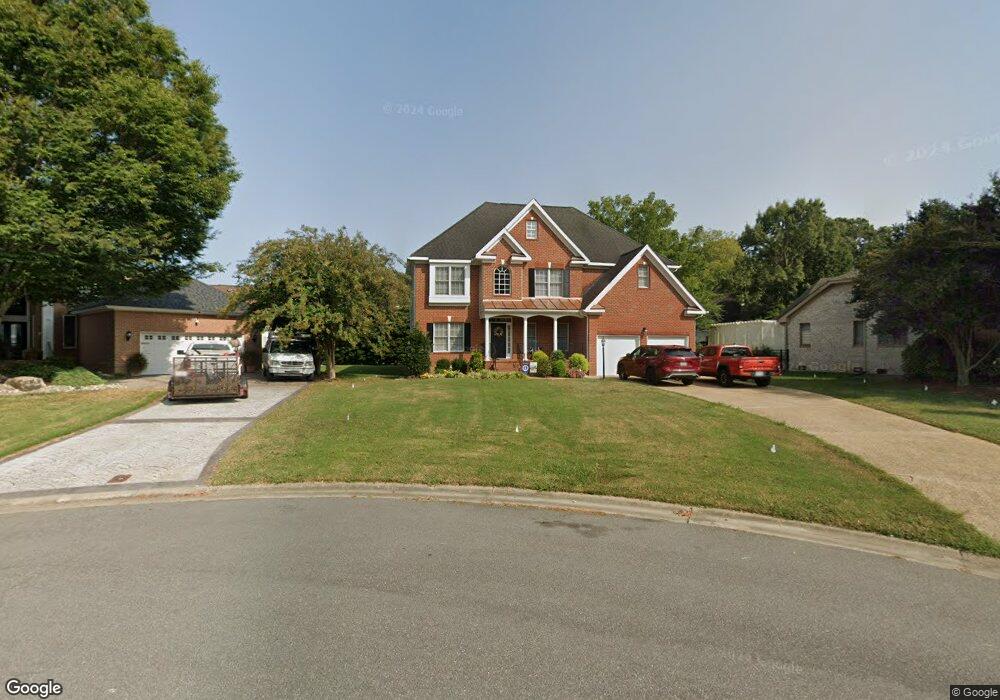
104 N James Landing Ct Smithfield, VA 23430
Estimated Value: $608,806 - $670,000
5
Beds
3
Baths
3,271
Sq Ft
$194/Sq Ft
Est. Value
About This Home
This home is located at 104 N James Landing Ct, Smithfield, VA 23430 and is currently estimated at $634,202, approximately $193 per square foot. 104 N James Landing Ct is a home located in Isle of Wight County with nearby schools including Carrollton Elementary School, Smithfield Middle School, and Smithfield High School.
Ownership History
Date
Name
Owned For
Owner Type
Purchase Details
Closed on
Dec 9, 2024
Sold by
Waters Stephen James
Bought by
Waters Stephen James and Zbur Samantha Lindsey
Current Estimated Value
Purchase Details
Closed on
Jul 9, 2024
Sold by
Pretlow Roderick H and Hayes Dia M
Bought by
Waters Stephen James
Home Financials for this Owner
Home Financials are based on the most recent Mortgage that was taken out on this home.
Original Mortgage
$605,000
Interest Rate
7.03%
Mortgage Type
VA
Purchase Details
Closed on
Jul 2, 2020
Sold by
Forehand Steven C
Bought by
Pretlow Roderick H and Hayes Dia M
Home Financials for this Owner
Home Financials are based on the most recent Mortgage that was taken out on this home.
Original Mortgage
$429,575
Interest Rate
3.1%
Mortgage Type
FHA
Purchase Details
Closed on
Sep 11, 2001
Sold by
Newhall Construction Co
Create a Home Valuation Report for This Property
The Home Valuation Report is an in-depth analysis detailing your home's value as well as a comparison with similar homes in the area
Home Values in the Area
Average Home Value in this Area
Purchase History
| Date | Buyer | Sale Price | Title Company |
|---|---|---|---|
| Waters Stephen James | -- | None Listed On Document | |
| Waters Stephen James | -- | None Listed On Document | |
| Waters Stephen James | $605,000 | Lafayette Title | |
| Pretlow Roderick H | $437,500 | Lafayette Title | |
| -- | $313,500 | -- |
Source: Public Records
Mortgage History
| Date | Status | Borrower | Loan Amount |
|---|---|---|---|
| Previous Owner | Waters Stephen James | $605,000 | |
| Previous Owner | Pretlow Roderick H | $429,575 |
Source: Public Records
Tax History
| Year | Tax Paid | Tax Assessment Tax Assessment Total Assessment is a certain percentage of the fair market value that is determined by local assessors to be the total taxable value of land and additions on the property. | Land | Improvement |
|---|---|---|---|---|
| 2025 | $4,189 | $540,500 | $106,000 | $434,500 |
| 2024 | $3,946 | $540,500 | $106,000 | $434,500 |
| 2023 | $3,892 | $540,500 | $106,000 | $434,500 |
| 2022 | $3,219 | $372,300 | $106,000 | $266,300 |
| 2021 | $3,219 | $372,300 | $106,000 | $266,300 |
| 2020 | $3,219 | $372,300 | $106,000 | $266,300 |
| 2019 | $3,219 | $372,300 | $106,000 | $266,300 |
| 2018 | $3,212 | $371,500 | $106,000 | $265,500 |
| 2016 | $3,230 | $371,500 | $106,000 | $265,500 |
| 2015 | $3,254 | $371,500 | $106,000 | $265,500 |
| 2014 | $3,254 | $374,300 | $106,000 | $268,300 |
| 2013 | -- | $374,300 | $106,000 | $268,300 |
Source: Public Records
Map
Nearby Homes
- 103 Clipper Creek Ln
- 203 Winterberry Ln
- 19655 Battery Park Rd
- 13 Jamesview Cir
- 10142 Bolling Blvd
- 20480 W Creek Place
- 23082 Retreat Ln
- 20527 Madison Ct
- 1214 Wharf Hill Dr
- 803 Lakeview Cove
- 1122 Wharf Hill Dr
- 2002 Wentworth Crossing
- 1301 Wharf Hill Dr
- 1310 Wharf Hill Dr
- 1314 Wharf Hill Dr
- 101 Lakeview Cove
- 1318 Wharf Hill Dr
- 1327 Wharf Hill Dr
- 307 Ridgeland Dr
- 2113 Wentworth Crossing
- 102 N James Landing Ct
- 106 N James Landing Ct
- 203 James Landing Cir
- 205 James Landing Cir
- 100 N James Landing Ct
- 207 James Landing Cir
- 108 N James Landing Ct
- 209 James Landing Cir
- 110 N James Landing Ct
- 105 N James Landing Ct
- 103 N James Landing Ct
- 107 N James Landing Ct
- 109 N James Landing Ct
- 101 N James Landing Ct
- 202 James Landing Cir
- 101 S James Landing Ct
- 210 James Landing Cir
- 208 James Landing Cir
- 204 James Landing Cir
- 213 James Landing Cir
Your Personal Tour Guide
Ask me questions while you tour the home.