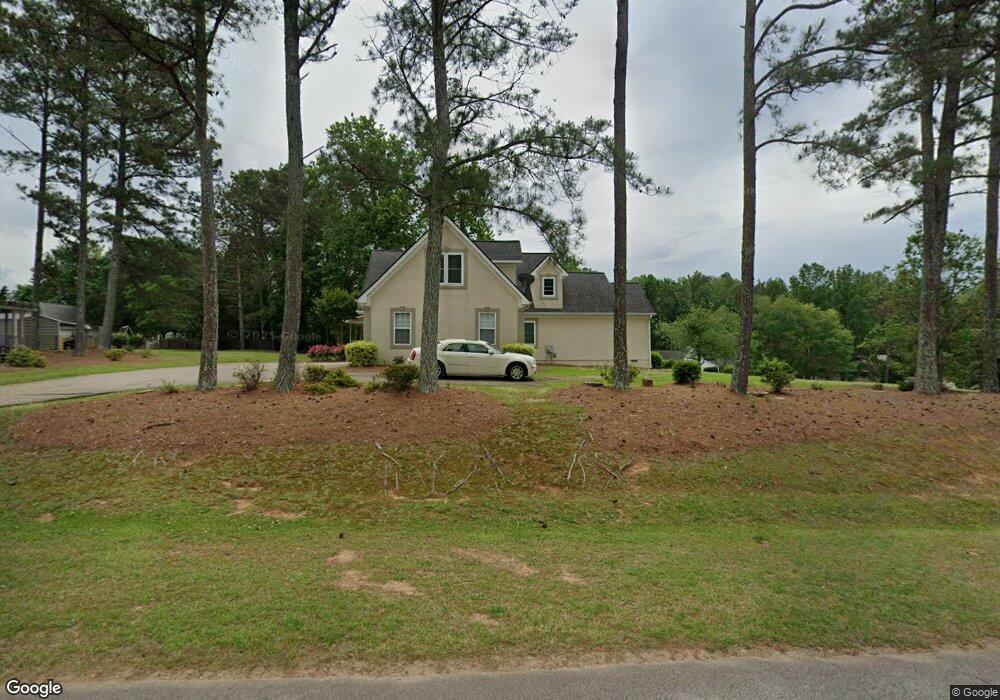
104 Oak Leaf Dr Carrollton, GA 30116
Estimated Value: $257,517 - $300,000
3
Beds
2
Baths
1,192
Sq Ft
$235/Sq Ft
Est. Value
About This Home
This home is located at 104 Oak Leaf Dr, Carrollton, GA 30116 and is currently estimated at $279,879, approximately $234 per square foot. 104 Oak Leaf Dr is a home located in Carroll County with nearby schools including Whitesburg Elementary School, Central Middle School, and Central High School.
Ownership History
Date
Name
Owned For
Owner Type
Purchase Details
Closed on
Mar 4, 2022
Sold by
Cochran Custom Homes Inc
Bought by
Lumpkin Justin
Current Estimated Value
Home Financials for this Owner
Home Financials are based on the most recent Mortgage that was taken out on this home.
Original Mortgage
$255,192
Outstanding Balance
$237,805
Interest Rate
3.69%
Mortgage Type
FHA
Estimated Equity
$42,074
Purchase Details
Closed on
Nov 2, 2021
Sold by
Mcateer Thomas
Bought by
Cochran Custom Homes Inc
Purchase Details
Closed on
Jun 20, 2019
Sold by
Wilson Deaidra P
Bought by
Mcateer Thomas
Home Financials for this Owner
Home Financials are based on the most recent Mortgage that was taken out on this home.
Original Mortgage
$156,289
Interest Rate
4%
Purchase Details
Closed on
Mar 3, 2000
Sold by
Morris Deaidra P
Bought by
Wilson Deaidra P
Purchase Details
Closed on
Sep 23, 1997
Sold by
Morris Morris and Morris Ward
Bought by
Morris Deaidra P
Purchase Details
Closed on
Jul 2, 1990
Bought by
Morris Morris and Morris Ward
Create a Home Valuation Report for This Property
The Home Valuation Report is an in-depth analysis detailing your home's value as well as a comparison with similar homes in the area
Home Values in the Area
Average Home Value in this Area
Purchase History
| Date | Buyer | Sale Price | Title Company |
|---|---|---|---|
| Lumpkin Justin | $259,900 | -- | |
| Cochran Custom Homes Inc | $182,000 | -- | |
| Mcateer Thomas | $153,000 | -- | |
| Wilson Deaidra P | -- | -- | |
| Morris Deaidra P | -- | -- | |
| Morris Morris | $70,500 | -- |
Source: Public Records
Mortgage History
| Date | Status | Borrower | Loan Amount |
|---|---|---|---|
| Open | Lumpkin Justin | $255,192 | |
| Previous Owner | Mcateer Thomas | $156,289 |
Source: Public Records
Tax History Compared to Growth
Tax History
| Year | Tax Paid | Tax Assessment Tax Assessment Total Assessment is a certain percentage of the fair market value that is determined by local assessors to be the total taxable value of land and additions on the property. | Land | Improvement |
|---|---|---|---|---|
| 2024 | $1,838 | $81,230 | $8,000 | $73,230 |
| 2023 | $1,838 | $74,670 | $8,000 | $66,670 |
| 2022 | $1,544 | $61,550 | $8,000 | $53,550 |
| 2021 | $1,384 | $53,967 | $8,000 | $45,967 |
| 2020 | $1,259 | $49,054 | $8,000 | $41,054 |
| 2019 | $1,194 | $46,134 | $8,000 | $38,134 |
| 2018 | $1,031 | $39,258 | $8,000 | $31,258 |
| 2017 | $1,024 | $38,858 | $8,000 | $30,858 |
| 2016 | $1,024 | $38,858 | $8,000 | $30,858 |
| 2015 | $889 | $31,784 | $6,000 | $25,784 |
| 2014 | $893 | $31,784 | $6,000 | $25,784 |
Source: Public Records
Map
Nearby Homes
- 185 White Oak Ct
- 143 Oak Leaf Dr Unit 163
- 143 Oak Leaf Dr
- 0 Clem Lowell Rd Unit 10479926
- 0 Clem Lowell Rd Unit 147578
- 0 Clem Lowell Rd Unit 7630669
- 184 Whooping Creek Church Rd
- 2716 Georgia 16
- 2800 Sr 16
- 2800 Georgia 16
- 2181 2201 Star Point
- 197 Westbrook Rd
- 2033 Old Newnan Rd
- 40 Westbrook Rd
- 106 Victoria Way
- 106 Victoria Vining
- 252 Mink Hollow Dr
- 22 Westbrook Rd
- 311 Hidden Lakes Dr
- 0 Bankhead Hwy and Sassafras Unit 140936
- 104 Oak Leaf Dr
- 204 White Oak Ct
- 85 Clem Lowell Rd
- 105 Oak Leaf Dr
- 201 White Oak Ct
- 103 Clem Lowell Rd
- 208 White Oak Ct
- 101 Oak Leaf Dr
- 195 White Oak Ct
- 195 White Oak Ct
- 195 White Oak Ct
- 195 White Oak Ct
- 195 White Oak Ct
- 131 Clem Lowell Rd
- 117 Whooping Creek Church Rd
- 213 White Oak Ct
- 47 Clem Lowell Rd
- 212 White Oak Ct Unit 14
- 212 White Oak Ct
- 116 Oak Leaf Dr