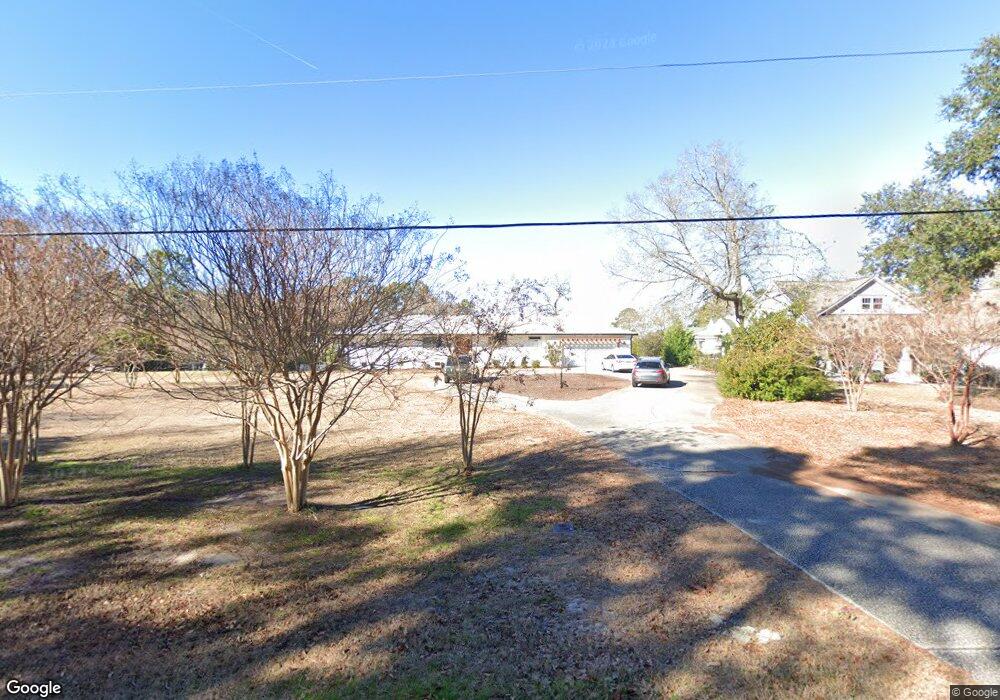
104 Olde Point Loop Hampstead, NC 28443
Estimated Value: $613,000 - $695,000
3
Beds
3
Baths
2,184
Sq Ft
$298/Sq Ft
Est. Value
About This Home
This home is located at 104 Olde Point Loop, Hampstead, NC 28443 and is currently estimated at $649,924, approximately $297 per square foot. 104 Olde Point Loop is a home located in Pender County with nearby schools including Topsail Elementary School, Topsail Middle School, and Topsail High School.
Ownership History
Date
Name
Owned For
Owner Type
Purchase Details
Closed on
Oct 22, 2021
Sold by
Bauer John A and Bauer Estela R
Bought by
Beaudoin Jeffrey and Jeffrey Beaudoin Living Trust
Current Estimated Value
Purchase Details
Closed on
May 6, 2006
Sold by
Smith Nat E and Smith Bonnie L
Bought by
Bauer John A and Bauer Estela R
Home Financials for this Owner
Home Financials are based on the most recent Mortgage that was taken out on this home.
Original Mortgage
$540,000
Interest Rate
6.5%
Mortgage Type
Adjustable Rate Mortgage/ARM
Purchase Details
Closed on
Nov 4, 2005
Sold by
Hardwick William Daniel and Hardwick Brenda
Bought by
Smith Nat E and Smith Bonnie L
Home Financials for this Owner
Home Financials are based on the most recent Mortgage that was taken out on this home.
Original Mortgage
$544,500
Interest Rate
5.76%
Mortgage Type
New Conventional
Create a Home Valuation Report for This Property
The Home Valuation Report is an in-depth analysis detailing your home's value as well as a comparison with similar homes in the area
Home Values in the Area
Average Home Value in this Area
Purchase History
| Date | Buyer | Sale Price | Title Company |
|---|---|---|---|
| Beaudoin Jeffrey | $564,000 | None Available | |
| Bauer John A | $675,000 | -- | |
| Smith Nat E | $605,000 | -- |
Source: Public Records
Mortgage History
| Date | Status | Borrower | Loan Amount |
|---|---|---|---|
| Previous Owner | Bauer John A | $540,000 | |
| Previous Owner | Smith Nat E | $544,500 |
Source: Public Records
Tax History
| Year | Tax Paid | Tax Assessment Tax Assessment Total Assessment is a certain percentage of the fair market value that is determined by local assessors to be the total taxable value of land and additions on the property. | Land | Improvement |
|---|---|---|---|---|
| 2025 | $2,649 | $608,837 | $179,208 | $429,629 |
| 2024 | $2,625 | $262,187 | $95,326 | $166,861 |
| 2023 | $2,625 | $262,187 | $95,326 | $166,861 |
| 2022 | $2,293 | $262,187 | $95,326 | $166,861 |
| 2021 | $2,293 | $262,187 | $95,326 | $166,861 |
| 2020 | $2,293 | $262,187 | $95,326 | $166,861 |
| 2019 | $2,293 | $262,187 | $95,326 | $166,861 |
| 2018 | $2,192 | $231,141 | $111,544 | $119,597 |
| 2017 | $2,192 | $231,141 | $111,544 | $119,597 |
| 2016 | $2,168 | $231,141 | $111,544 | $119,597 |
| 2015 | $2,150 | $231,141 | $111,544 | $119,597 |
| 2014 | $1,673 | $231,141 | $111,544 | $119,597 |
| 2013 | -- | $231,141 | $111,544 | $119,597 |
| 2012 | -- | $231,141 | $111,544 | $119,597 |
Source: Public Records
Map
Nearby Homes
- 102 Olde Point Loop
- 1984 Kings Landing Rd
- 1966 Kings Landing Rd
- 218 Olde Point Loop
- 557 Button Bush Ln
- 1676 Kings Landing Rd
- 108 Deer Cove Rd
- 151 Olde Point Rd
- 2001 Cordgrass Rd
- 703 Brown Pelican Ln
- 496 Captain Beam Blvd
- 1475 Kings Landing Rd
- 610 Sawgrass Rd
- 1406 Kings Landing Rd
- 378 Aster Place
- 420 Kings Landing Rd
- 606 Ravenswood Rd
- 203 W Weatherbee Way
- 59 E Weatherbee Way
- 38 Treasure Way
- 106 Olde Point Loop
- 108 Olde Point Loop
- 184 Olde Point Rd
- 186 Olde Point Rd
- 304 Gull Rd
- Lot Olde Point
- Lot55 Olde Point Loop
- 182 Olde Point Rd
- Lot 55 Olde Point Loop
- 107 Olde Point Loop
- 302 Gull Rd
- 306 Gull Rd
- 109 Olde Point Loop
- 109 Olde Point Loop
- 180 Olde Point Rd
- 112 Olde Point Loop
- 600 Oyster Catcher Dr
- 556 Osprey Dr
- 119 White Heron Cove Rd
- 119 White Heron Cove
Your Personal Tour Guide
Ask me questions while you tour the home.