Estimated Value: $395,000 - $419,572
6
Beds
4
Baths
3,475
Sq Ft
$118/Sq Ft
Est. Value
About This Home
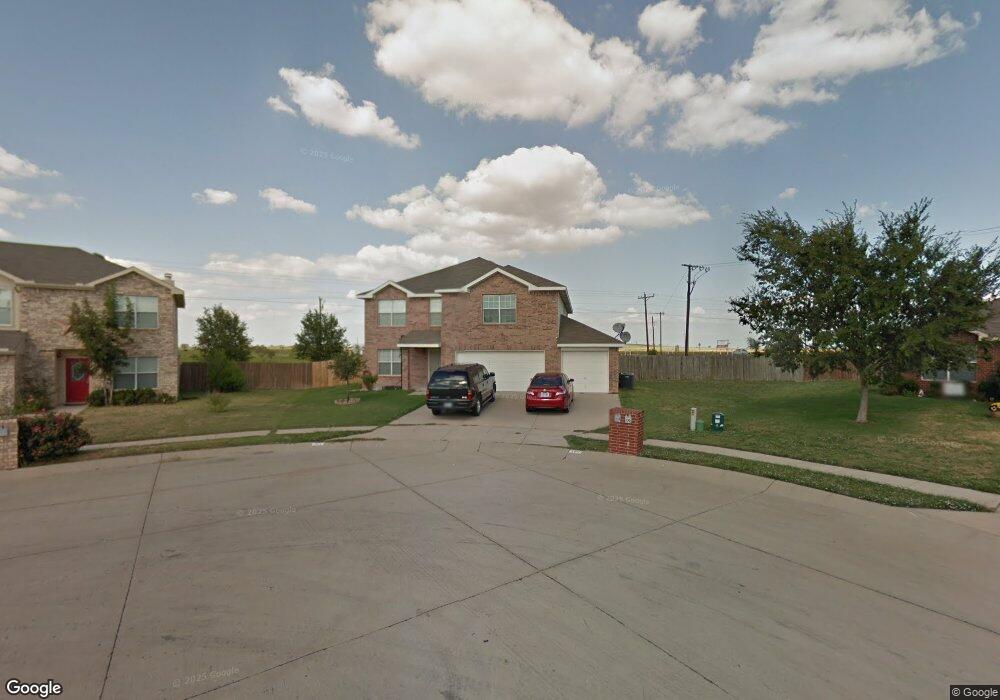
This home is located at 104 Palomino Ln, Krum, TX 76249 and is currently estimated at $408,643, approximately $117 per square foot. 104 Palomino Ln is a home located in Denton County with nearby schools including Krum Early Education Center, Blanche Dodd Intermediate School, and Krum Middle School.
Ownership History
Date
Name
Owned For
Owner Type
Purchase Details
Closed on
Nov 8, 2023
Sold by
Crouch Yvonne
Bought by
Crouch Derrick
Current Estimated Value
Purchase Details
Closed on
Feb 16, 2016
Sold by
Us Bank National Association
Bought by
Crouch Derrick W
Home Financials for this Owner
Home Financials are based on the most recent Mortgage that was taken out on this home.
Original Mortgage
$172,030
Interest Rate
3.79%
Mortgage Type
New Conventional
Purchase Details
Closed on
Nov 3, 2015
Sold by
Mann Davinder and First Consolidated Mortgage Co
Bought by
U S Bank National Association
Purchase Details
Closed on
Mar 15, 2006
Sold by
History Maker Inc
Bought by
Mann Davinder
Home Financials for this Owner
Home Financials are based on the most recent Mortgage that was taken out on this home.
Original Mortgage
$180,000
Interest Rate
6.19%
Mortgage Type
Fannie Mae Freddie Mac
Create a Home Valuation Report for This Property
The Home Valuation Report is an in-depth analysis detailing your home's value as well as a comparison with similar homes in the area
Home Values in the Area
Average Home Value in this Area
Purchase History
| Date | Buyer | Sale Price | Title Company |
|---|---|---|---|
| Crouch Derrick | -- | None Listed On Document | |
| Crouch Derrick W | -- | Attorney | |
| U S Bank National Association | $202,476 | None Available | |
| Mann Davinder | -- | Stewart Title |
Source: Public Records
Mortgage History
| Date | Status | Borrower | Loan Amount |
|---|---|---|---|
| Previous Owner | Crouch Derrick W | $172,030 | |
| Previous Owner | Mann Davinder | $180,000 |
Source: Public Records
Tax History Compared to Growth
Tax History
| Year | Tax Paid | Tax Assessment Tax Assessment Total Assessment is a certain percentage of the fair market value that is determined by local assessors to be the total taxable value of land and additions on the property. | Land | Improvement |
|---|---|---|---|---|
| 2025 | $6,734 | $397,000 | $92,189 | $304,811 |
| 2024 | $7,974 | $395,670 | $0 | $0 |
| 2023 | $6,021 | $359,700 | $92,189 | $345,811 |
| 2022 | $7,501 | $327,000 | $92,189 | $234,811 |
| 2021 | $6,653 | $300,000 | $57,874 | $242,126 |
| 2020 | $6,376 | $281,552 | $57,874 | $235,348 |
| 2019 | $6,176 | $255,957 | $57,874 | $230,610 |
| 2018 | $5,643 | $232,688 | $57,874 | $174,814 |
| 2017 | $5,207 | $213,777 | $57,874 | $155,903 |
| 2016 | $4,800 | $202,501 | $38,412 | $164,089 |
| 2015 | $4,335 | $206,047 | $38,412 | $167,635 |
| 2013 | -- | $168,838 | $38,412 | $130,426 |
Source: Public Records
Map
Nearby Homes
- 101 Thoroughbred Dr
- TBD Masch Branch Rd
- 1623 Withers Way
- 1604 Withers Way
- 0 Farm To Market Road 1173
- 1404 Wenatchee Dr
- 1304 Dakota Trail
- 1627 Kawati Way
- 328 Broken Bow
- 334 Saddlebrook Dr
- 3454 Eloise Ln
- 1620 Kawati Way
- 3537 Camden Creek Rd
- 1536 Wagon Wheel Way
- 205 Broken Arrow
- 1500 Radecke Rd
- TBD E Mccart St
- 5225 Mountain View Dr
- 5266 Meadow Ln
- 5213 Meadow Ln
- 106 Palomino Ln
- 1620 Palomino Ln
- 108 Palomino Ln
- 1618 Palomino Ln
- 105 Palomino Ln
- 110 Palomino Ln
- 1616 Palomino Ln
- 107 Palomino Ln
- 112 Palomino Ln
- 1614 Palomino Ln
- 109 Palomino Ln
- 114 Palomino Ln
- 108 Thoroughbred Dr
- 106 Thoroughbred Dr
- 111 Palomino Ln
- 110 Thoroughbred Dr
- 116 Palomino Ln
- 113 Palomino Ln
- 103 Thoroughbred Dr
- 105 Thoroughbred Dr