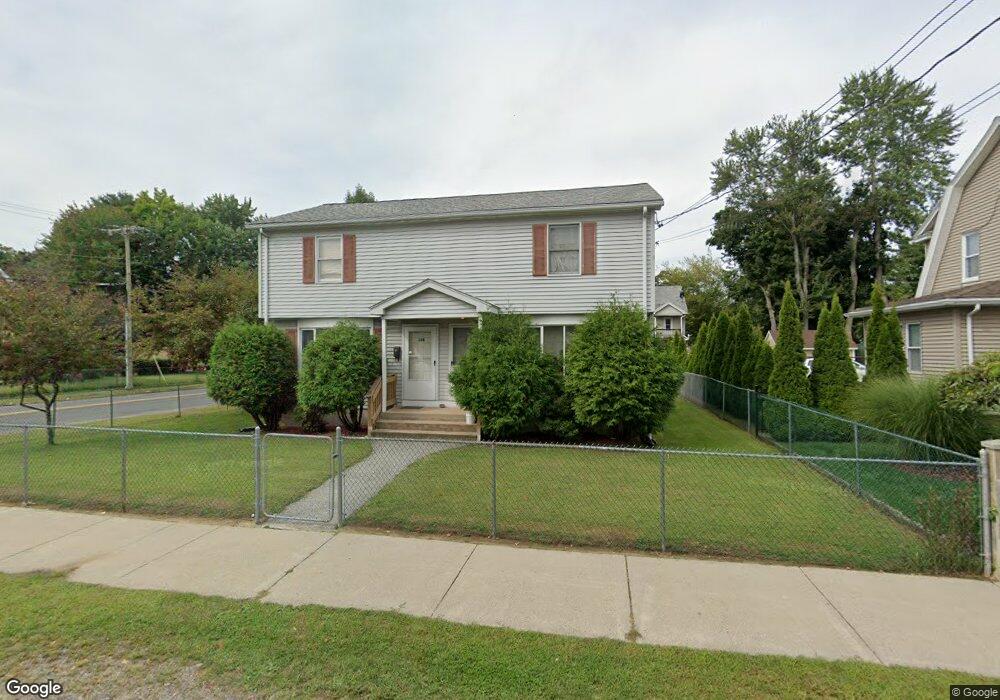
104 Pasco Rd Indian Orchard, MA 01151
Indian Orchard NeighborhoodEstimated Value: $274,000 - $382,000
4
Beds
2
Baths
1,764
Sq Ft
$186/Sq Ft
Est. Value
About This Home
This home is located at 104 Pasco Rd, Indian Orchard, MA 01151 and is currently estimated at $328,304, approximately $186 per square foot. 104 Pasco Rd is a home located in Hampden County with nearby schools including Indian Orchard Elementary School, John F. Kennedy Academy, and Roger L. Putnam Vocational Technical Academy.
Ownership History
Date
Name
Owned For
Owner Type
Purchase Details
Closed on
Oct 2, 2002
Sold by
Poon Cheuk Kong and Poon Yim Wah
Bought by
Poon Stanley L
Current Estimated Value
Home Financials for this Owner
Home Financials are based on the most recent Mortgage that was taken out on this home.
Original Mortgage
$86,700
Outstanding Balance
$36,640
Interest Rate
6.27%
Mortgage Type
Purchase Money Mortgage
Estimated Equity
$291,664
Purchase Details
Closed on
Nov 12, 1991
Sold by
Laframboise Warren J and Mosellen John M
Bought by
Poon Cheuk K and Poon Yim W
Home Financials for this Owner
Home Financials are based on the most recent Mortgage that was taken out on this home.
Original Mortgage
$55,000
Interest Rate
8.85%
Mortgage Type
Purchase Money Mortgage
Create a Home Valuation Report for This Property
The Home Valuation Report is an in-depth analysis detailing your home's value as well as a comparison with similar homes in the area
Home Values in the Area
Average Home Value in this Area
Purchase History
| Date | Buyer | Sale Price | Title Company |
|---|---|---|---|
| Poon Stanley L | $102,000 | -- | |
| Poon Stanley L | $102,000 | -- | |
| Poon Cheuk K | $95,000 | -- | |
| Poon Cheuk K | $95,000 | -- |
Source: Public Records
Mortgage History
| Date | Status | Borrower | Loan Amount |
|---|---|---|---|
| Open | Poon Cheuk K | $86,700 | |
| Closed | Poon Cheuk K | $86,700 | |
| Previous Owner | Poon Cheuk K | $55,000 |
Source: Public Records
Tax History Compared to Growth
Tax History
| Year | Tax Paid | Tax Assessment Tax Assessment Total Assessment is a certain percentage of the fair market value that is determined by local assessors to be the total taxable value of land and additions on the property. | Land | Improvement |
|---|---|---|---|---|
| 2025 | $4,381 | $279,400 | $45,000 | $234,400 |
| 2024 | $4,492 | $279,700 | $42,100 | $237,600 |
| 2023 | $4,179 | $245,100 | $34,500 | $210,600 |
| 2022 | $4,048 | $215,100 | $32,200 | $182,900 |
| 2021 | $3,759 | $198,900 | $29,300 | $169,600 |
| 2020 | $3,791 | $194,100 | $29,300 | $164,800 |
| 2019 | $3,237 | $164,500 | $30,400 | $134,100 |
| 2018 | $3,104 | $157,700 | $30,400 | $127,300 |
| 2017 | $2,890 | $147,000 | $25,800 | $121,200 |
| 2016 | $2,373 | $120,700 | $25,800 | $94,900 |
| 2015 | $2,315 | $117,700 | $25,800 | $91,900 |
Source: Public Records
Map
Nearby Homes