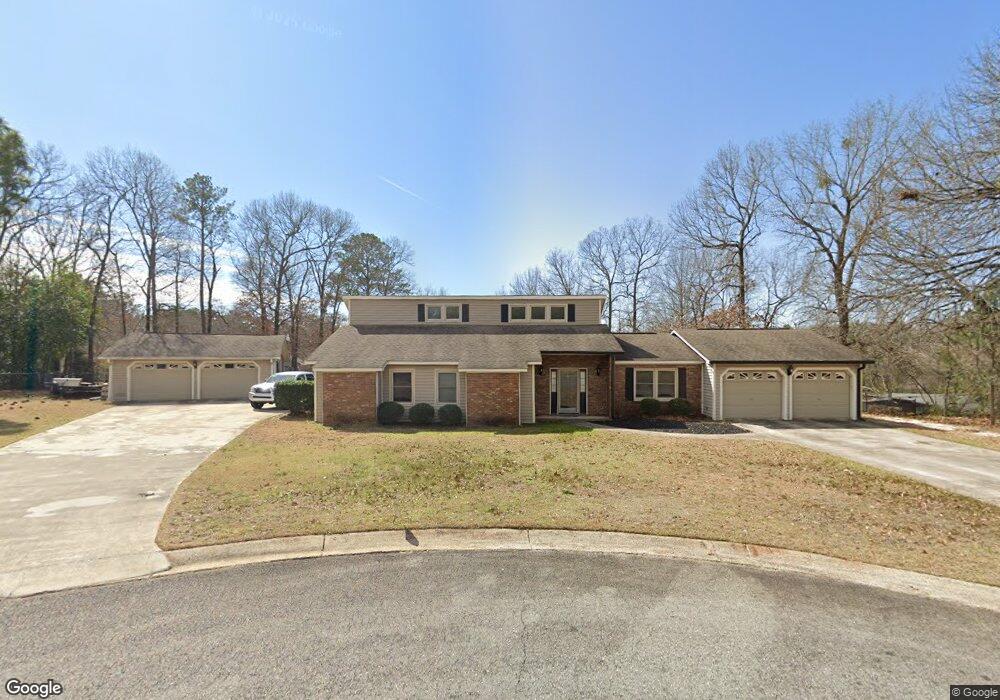
104 Pine Glen Ct Centerville, GA 31028
Estimated Value: $248,000 - $294,000
4
Beds
3
Baths
2,674
Sq Ft
$103/Sq Ft
Est. Value
About This Home
This home is located at 104 Pine Glen Ct, Centerville, GA 31028 and is currently estimated at $274,628, approximately $102 per square foot. 104 Pine Glen Ct is a home located in Houston County with nearby schools including Centerville Elementary School, Northside Middle School, and Northside High School.
Ownership History
Date
Name
Owned For
Owner Type
Purchase Details
Closed on
May 15, 2012
Sold by
Johnson Johnny M and Johnson Barbara B
Bought by
Calvao Daniel R
Current Estimated Value
Home Financials for this Owner
Home Financials are based on the most recent Mortgage that was taken out on this home.
Original Mortgage
$120,000
Outstanding Balance
$82,088
Interest Rate
4.01%
Mortgage Type
New Conventional
Estimated Equity
$192,540
Purchase Details
Closed on
Jun 27, 1986
Sold by
Mccain Steve A and Mccain Sandra E
Bought by
Johnson Johnny M and Johnson Barbara B
Purchase Details
Closed on
Jun 14, 1984
Sold by
Harridge Ross
Bought by
Mccain Steve A and Mccain Sandra E
Purchase Details
Closed on
Feb 17, 1984
Sold by
Bertram George O
Bought by
Harridge Ross
Purchase Details
Closed on
Jan 25, 1983
Sold by
Benchmark Dev Inc
Bought by
Bertram George O
Create a Home Valuation Report for This Property
The Home Valuation Report is an in-depth analysis detailing your home's value as well as a comparison with similar homes in the area
Home Values in the Area
Average Home Value in this Area
Purchase History
| Date | Buyer | Sale Price | Title Company |
|---|---|---|---|
| Calvao Daniel R | $150,000 | None Available | |
| Johnson Johnny M | $73,500 | -- | |
| Mccain Steve A | $67,000 | -- | |
| Harridge Ross | $13,800 | -- | |
| Bertram George O | $29,800 | -- |
Source: Public Records
Mortgage History
| Date | Status | Borrower | Loan Amount |
|---|---|---|---|
| Open | Calvao Daniel R | $120,000 |
Source: Public Records
Tax History
| Year | Tax Paid | Tax Assessment Tax Assessment Total Assessment is a certain percentage of the fair market value that is determined by local assessors to be the total taxable value of land and additions on the property. | Land | Improvement |
|---|---|---|---|---|
| 2025 | $2,821 | $97,040 | $8,000 | $89,040 |
| 2024 | $3,218 | $92,760 | $8,000 | $84,760 |
| 2023 | $2,732 | $78,200 | $7,920 | $70,280 |
| 2022 | $1,463 | $63,640 | $6,600 | $57,040 |
| 2021 | $1,343 | $58,080 | $5,480 | $52,600 |
| 2020 | $1,337 | $57,560 | $5,480 | $52,080 |
| 2019 | $1,337 | $57,560 | $5,480 | $52,080 |
| 2018 | $1,337 | $57,560 | $5,480 | $52,080 |
| 2017 | $1,339 | $57,560 | $5,480 | $52,080 |
| 2016 | $1,341 | $57,560 | $5,480 | $52,080 |
| 2015 | $1,343 | $57,560 | $5,480 | $52,080 |
| 2014 | -- | $57,560 | $5,480 | $52,080 |
| 2013 | -- | $57,560 | $5,480 | $52,080 |
Source: Public Records
Map
Nearby Homes
- 102 Pine Glen Ct
- 218 Valencia Cir
- 202 Magnolia Glen
- 312 Hickory Glen
- 105 Maple Glen Ct
- 205 Scarborough Rd
- 136 Scarborough Rd
- 106 Maple Glen Ct
- 106 Scarborough Rd
- 117 Crestwood Ct
- 121 Crestwood Rd
- 105 Eagles Ridge
- 110 Wray St
- 108 Weaver Rd
- 201 Eagles Landing Trail
- 156 Martin Mill Trail
- 210 Webb St
- 110 Stonefield Ct
- 857 Ola Dr
- 200 Collins Estate Ave
- 314 Woodhaven Rd
- 102 Dogwood Glen
- 106 Pine Glen Ct
- 312 Woodhaven Rd
- 316 Woodhaven Rd
- 107 Pine Glen Ct
- 108 Pine Glen Ct
- 100 Pine Glen Ct
- 105 Pine Glen Ct
- 216 Valencia Cir
- 103 Pine Glen Ct
- 310 Woodhaven Rd
- 214 Valencia Cir
- 106 Persimmon Glen Ct
- 119 Dogwood Glen
- 101 Dogwood Glen
- 103 Dogwood Glen
- 212 Valencia Cir
- 105 Dogwood Glen
- 101 Pine Glen Ct
Your Personal Tour Guide
Ask me questions while you tour the home.