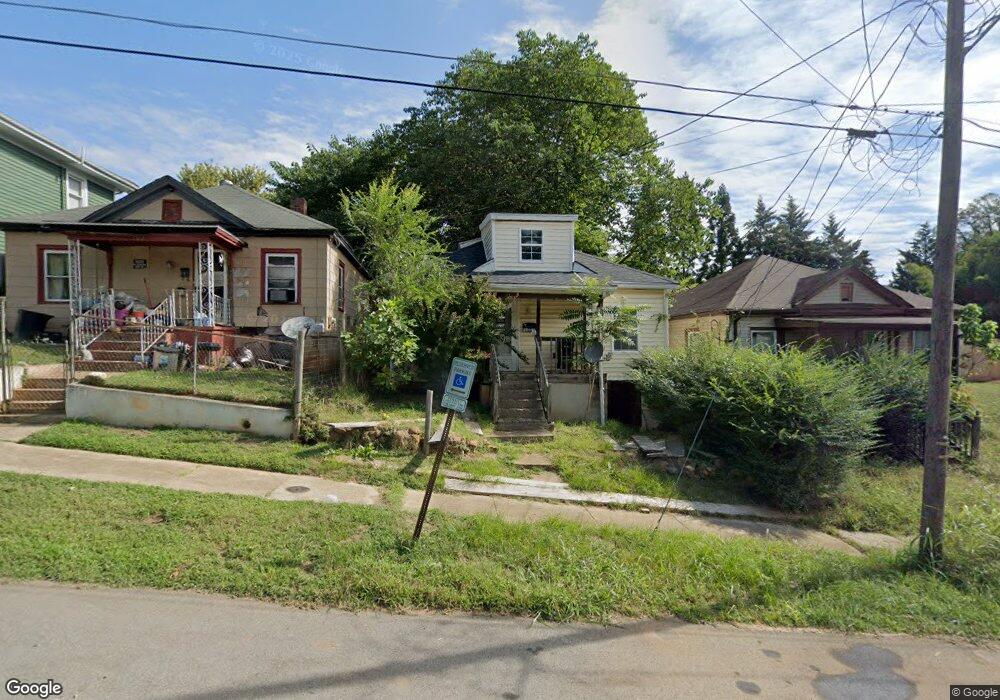
104 Polk St Lynchburg, VA 24504
Tinbridge Hill NeighborhoodEstimated Value: $69,000 - $144,000
4
Beds
2
Baths
1,236
Sq Ft
$78/Sq Ft
Est. Value
About This Home
This home is located at 104 Polk St, Lynchburg, VA 24504 and is currently estimated at $96,113, approximately $77 per square foot. 104 Polk St is a home located in Lynchburg City with nearby schools including Bedford Hills Elementary School, Linkhorne Middle School, and E.C. Glass High School.
Ownership History
Date
Name
Owned For
Owner Type
Purchase Details
Closed on
Dec 19, 2024
Sold by
Jones Johnston & White Pc
Bought by
Polk Street Investment Trust and Karol
Current Estimated Value
Purchase Details
Closed on
Jul 6, 2022
Sold by
Adam Karol Trust
Bought by
Jean Capital Llc
Home Financials for this Owner
Home Financials are based on the most recent Mortgage that was taken out on this home.
Original Mortgage
$77,500
Interest Rate
5.09%
Mortgage Type
Construction
Purchase Details
Closed on
Feb 26, 2021
Sold by
Hancock Christopher and Hancock Diane
Bought by
Street Trust
Purchase Details
Closed on
Jan 8, 2007
Sold by
First Option Properties Llc
Bought by
Hancock Christopher and Hancock Diane
Purchase Details
Closed on
Mar 29, 2005
Sold by
Saunders Betty J and Booth Dana
Bought by
First Option Properties
Create a Home Valuation Report for This Property
The Home Valuation Report is an in-depth analysis detailing your home's value as well as a comparison with similar homes in the area
Home Values in the Area
Average Home Value in this Area
Purchase History
| Date | Buyer | Sale Price | Title Company |
|---|---|---|---|
| Polk Street Investment Trust | $65,323 | None Listed On Document | |
| Jean Capital Llc | $52,500 | Chicago Title | |
| Street Trust | $25,000 | None Available | |
| Hancock Christopher | -- | None Available | |
| First Option Properties | -- | None Available |
Source: Public Records
Mortgage History
| Date | Status | Borrower | Loan Amount |
|---|---|---|---|
| Previous Owner | Jean Capital Llc | $77,500 |
Source: Public Records
Tax History Compared to Growth
Tax History
| Year | Tax Paid | Tax Assessment Tax Assessment Total Assessment is a certain percentage of the fair market value that is determined by local assessors to be the total taxable value of land and additions on the property. | Land | Improvement |
|---|---|---|---|---|
| 2025 | $732 | $87,100 | $15,000 | $72,100 |
| 2024 | $377 | $42,400 | $10,800 | $31,600 |
| 2023 | $377 | $42,400 | $10,800 | $31,600 |
| 2022 | $287 | $27,900 | $9,000 | $18,900 |
| 2021 | $310 | $27,900 | $9,000 | $18,900 |
| 2020 | $566 | $51,000 | $6,000 | $45,000 |
| 2019 | $566 | $51,000 | $6,000 | $45,000 |
| 2018 | $324 | $50,100 | $6,000 | $44,100 |
| 2017 | $556 | $50,100 | $6,000 | $44,100 |
| 2016 | $92 | $50,100 | $6,000 | $44,100 |
| 2015 | $92 | $50,100 | $2,000 | $48,100 |
| 2014 | $92 | $50,100 | $2,000 | $48,100 |
Source: Public Records
Map
Nearby Homes