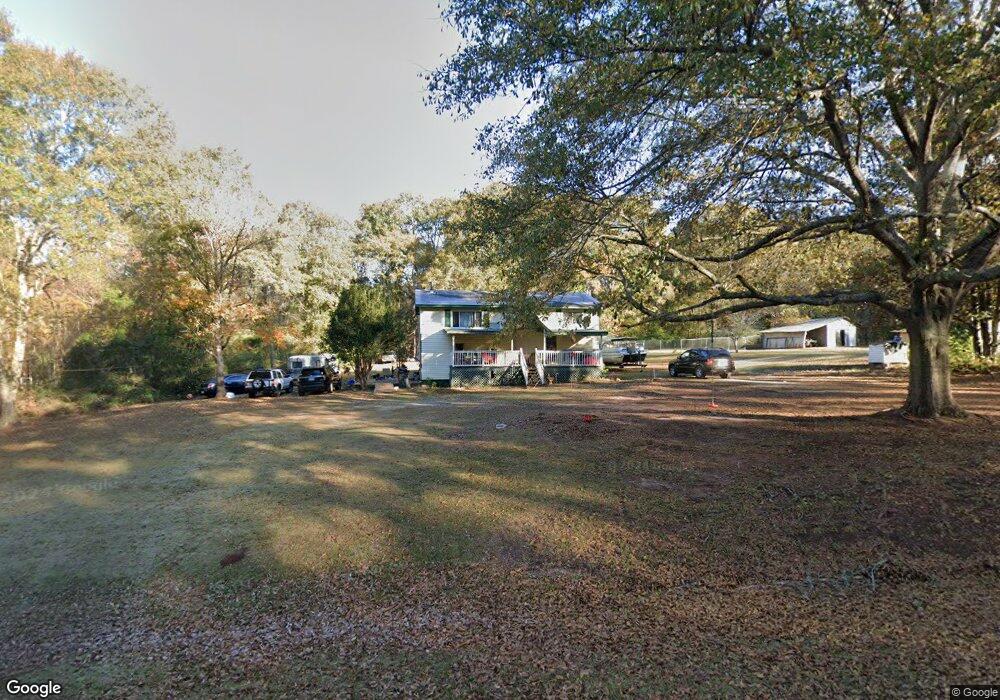
104 Potts Rd Lagrange, GA 30240
Estimated Value: $228,000 - $303,000
4
Beds
3
Baths
1,920
Sq Ft
$135/Sq Ft
Est. Value
About This Home
This home is located at 104 Potts Rd, Lagrange, GA 30240 and is currently estimated at $258,837, approximately $134 per square foot. 104 Potts Rd is a home located in Troup County with nearby schools including Long Cane Elementary School, West Point Elementary School, and Berta Weathersbee Elementary School.
Ownership History
Date
Name
Owned For
Owner Type
Purchase Details
Closed on
Jan 22, 2015
Sold by
Butler Minnie Ruth
Bought by
Bryan Pete
Current Estimated Value
Home Financials for this Owner
Home Financials are based on the most recent Mortgage that was taken out on this home.
Original Mortgage
$26,000
Interest Rate
4.01%
Purchase Details
Closed on
Jul 31, 2013
Sold by
Butler Melvin J
Bought by
Butler Melvin J and Butler Minnie Ruth
Purchase Details
Closed on
Dec 28, 1998
Sold by
Dorsey David
Bought by
Hester Richard L and Hester Kathy R
Purchase Details
Closed on
May 31, 1996
Sold by
W D and Ruby Tyler
Bought by
Dorsey David
Purchase Details
Closed on
May 30, 1996
Sold by
Joel D Tyler
Bought by
W D and Ruby Tyler
Purchase Details
Closed on
Jul 1, 1970
Sold by
Tyler W D
Bought by
Joel D Tyler
Create a Home Valuation Report for This Property
The Home Valuation Report is an in-depth analysis detailing your home's value as well as a comparison with similar homes in the area
Purchase History
| Date | Buyer | Sale Price | Title Company |
|---|---|---|---|
| Bryan Pete | $20,000 | -- | |
| Thacker Michael | $23,000 | -- | |
| Butler Melvin J | -- | -- | |
| Hester Richard L | $74,500 | -- | |
| Dorsey David | -- | -- | |
| W D | -- | -- | |
| Joel D Tyler | -- | -- |
Source: Public Records
Mortgage History
| Date | Status | Borrower | Loan Amount |
|---|---|---|---|
| Closed | Thacker Michael | $26,000 |
Source: Public Records
Tax History
| Year | Tax Paid | Tax Assessment Tax Assessment Total Assessment is a certain percentage of the fair market value that is determined by local assessors to be the total taxable value of land and additions on the property. | Land | Improvement |
|---|---|---|---|---|
| 2025 | $2,044 | $74,940 | $10,400 | $64,540 |
| 2024 | $1,621 | $59,428 | $10,400 | $49,028 |
| 2023 | $1,579 | $57,912 | $10,400 | $47,512 |
| 2022 | $1,513 | $54,192 | $10,400 | $43,792 |
| 2021 | $1,531 | $50,772 | $10,200 | $40,572 |
| 2020 | $1,377 | $45,652 | $8,400 | $37,252 |
| 2019 | $1,371 | $45,460 | $8,400 | $37,060 |
| 2018 | $1,269 | $42,088 | $8,400 | $33,688 |
| 2017 | $1,269 | $42,088 | $8,400 | $33,688 |
| 2016 | $1,237 | $41,001 | $8,439 | $32,562 |
| 2015 | $1,239 | $41,001 | $8,439 | $32,562 |
| 2014 | $1,358 | $44,872 | $8,439 | $36,433 |
| 2013 | -- | $47,378 | $8,439 | $38,938 |
Source: Public Records
Map
Nearby Homes
- 90 Hickory Ln
- 0 Lambert Rd
- 5714 W Point Rd
- Sandtown Road Unit: 1 2+ - Acre
- 0 Sandtown Rd Unit 10255987
- 107 Sweetwater Ct
- 102 Bridgewater Dr
- 107 Waters Edge Dr
- 0 Warner Rd Unit 10686116
- 648 Warner Rd
- 206 Ann Murphy Rd
- 1111 County Road 212
- 0 Ga Highway 0116 Unit 10619139
- 4172 Bartley Rd
- 101 Garden Walk Unit 85
- 1114 Clara Dr E
- 1111 Clara Dr E
- 0 Johns Rd Unit 10615130
- 1903 Ridgewood Dr
- 508 Pine St
- 2.02 Acres Potts Rd
- 84 Potts Rd
- 120 Potts Rd
- 130 Potts Rd
- 131 Potts Rd
- 184 Potts Rd
- 169 Potts Rd
- 198 Potts Rd
- 204 Potts Rd
- 93 Tyler St
- 81 Tyler St
- 6098 West Point Rd
- 0 Potts Rd Unit 7403021
- 0 Potts Rd Unit 8396569
- 111 Tyler St
- 6080 West Point Rd
- 6070 W Point Rd
- 6224 West Point Rd
- 6224 West Point
- 6070 West Point Rd
Your Personal Tour Guide
Ask me questions while you tour the home.