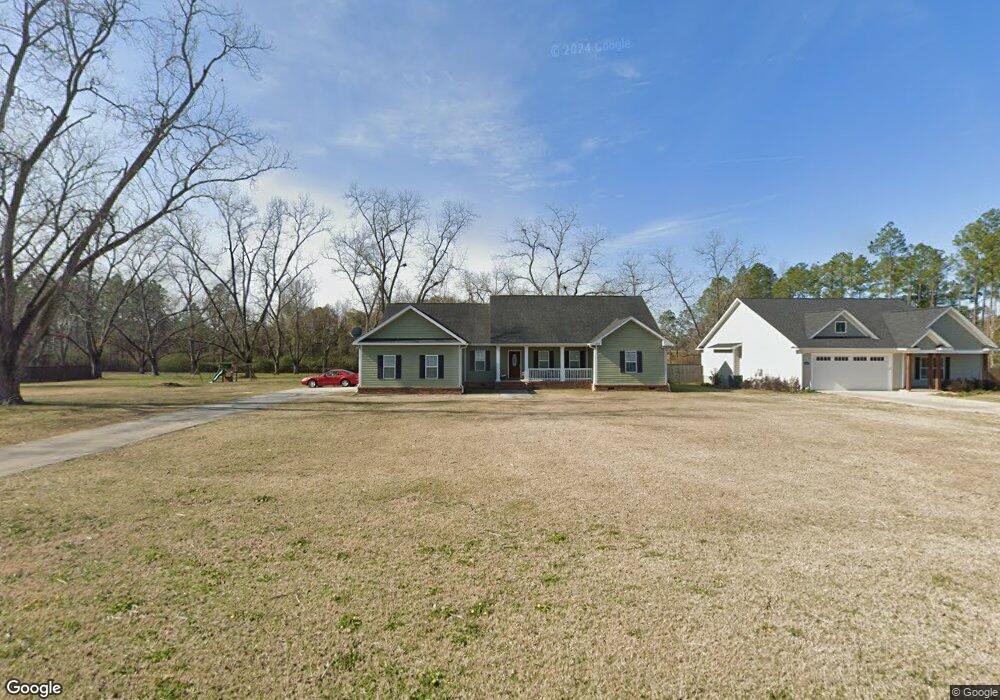
104 Quail Ridge St Ochlocknee, GA 31773
Estimated Value: $348,325 - $400,000
--
Bed
2
Baths
2,192
Sq Ft
$170/Sq Ft
Est. Value
About This Home
This home is located at 104 Quail Ridge St, Ochlocknee, GA 31773 and is currently estimated at $372,581, approximately $169 per square foot. 104 Quail Ridge St is a home located in Thomas County with nearby schools including Hand in Hand Primary School, Cross Creek Elementary School, and Garrison-Pilcher Elementary School.
Ownership History
Date
Name
Owned For
Owner Type
Purchase Details
Closed on
Aug 23, 2010
Sold by
Chatmon James Jerome
Bought by
Chatmon James Jerome and Chatmon Kathy
Current Estimated Value
Home Financials for this Owner
Home Financials are based on the most recent Mortgage that was taken out on this home.
Original Mortgage
$157,874
Interest Rate
4.59%
Mortgage Type
FHA
Purchase Details
Closed on
Mar 2, 2010
Sold by
Parrish Christopher E
Bought by
Chase Home Finance Llc
Purchase Details
Closed on
May 17, 2007
Sold by
Norman Robin Davis
Bought by
Parrish Christopher E and Parrish Roslie A
Home Financials for this Owner
Home Financials are based on the most recent Mortgage that was taken out on this home.
Original Mortgage
$136,500
Interest Rate
6.12%
Mortgage Type
New Conventional
Create a Home Valuation Report for This Property
The Home Valuation Report is an in-depth analysis detailing your home's value as well as a comparison with similar homes in the area
Home Values in the Area
Average Home Value in this Area
Purchase History
| Date | Buyer | Sale Price | Title Company |
|---|---|---|---|
| Chatmon James Jerome | $160,000 | -- | |
| Chatmon James Jerome | $160,000 | -- | |
| Chase Home Finance Llc | $220,000 | -- | |
| Parrish Christopher E | $35,000 | -- |
Source: Public Records
Mortgage History
| Date | Status | Borrower | Loan Amount |
|---|---|---|---|
| Closed | Chatmon James Jerome | $157,874 | |
| Previous Owner | Parrish Christopher E | $136,500 |
Source: Public Records
Tax History Compared to Growth
Tax History
| Year | Tax Paid | Tax Assessment Tax Assessment Total Assessment is a certain percentage of the fair market value that is determined by local assessors to be the total taxable value of land and additions on the property. | Land | Improvement |
|---|---|---|---|---|
| 2024 | $2,913 | $142,874 | $15,180 | $127,694 |
| 2023 | $2,681 | $134,777 | $13,800 | $120,977 |
| 2022 | $2,542 | $115,998 | $12,000 | $103,998 |
| 2021 | $2,382 | $98,956 | $12,000 | $86,956 |
| 2020 | $2,297 | $93,176 | $12,000 | $81,176 |
| 2019 | $2,322 | $93,176 | $12,000 | $81,176 |
| 2018 | $2,305 | $90,640 | $12,000 | $78,640 |
| 2017 | $2,279 | $88,273 | $10,680 | $77,593 |
| 2016 | $2,219 | $85,398 | $10,680 | $74,718 |
| 2015 | $2,101 | $79,760 | $9,960 | $69,800 |
| 2014 | $2,066 | $78,110 | $9,960 | $68,150 |
| 2013 | -- | $78,110 | $9,960 | $68,150 |
Source: Public Records
Map
Nearby Homes
- 105 Mossy Creek Way
- 107 Mossy Creek Way
- 00 Parcel # 053a313 West Shore Dr Lot 21
- 475 W Shore Dr
- 365 W Shore Dr
- 693 W Shore Dr
- 800 N Westshore Dr
- 800 Westshore Dr
- 106 Spiral Rd
- 250 Knoll Rd
- 171 Longwood Dr
- 8805 Georgia 202
- 475 Longwood Dr
- 210 Egg and Butter Rd N
- 210 Egg & Butter Rd
- 7216 Georgia 202
- 7216 Ga Highway 202
- 900 Benton Rd
- 10806 Georgia 202
- 23481 U S 19
- 104 Quail Ridge
- 100 Quail Ridge St Unit 1
- 100 Quail Ridge St
- 108 Quail Ridge St
- 103 Quail Ridge
- 105 Quail Ridge
- 103 Quail Ridge St
- 105 Quail Ridge St
- 107 Quail Ridge
- 101 Quail Ridge St Unit 23
- 107 Quail Ridge St Unit 20
- 107 Quail Ridge St
- 110 Quail Ridge
- 123 Quail Ridge
- 480 Baldwin Rd
- 111 Quail Ridge
- 112 Quail Ridge St Unit 6
- 112 Quail Ridge St
- 111 Quail Ridge St
- 114 Quail Ridge St Unit 7