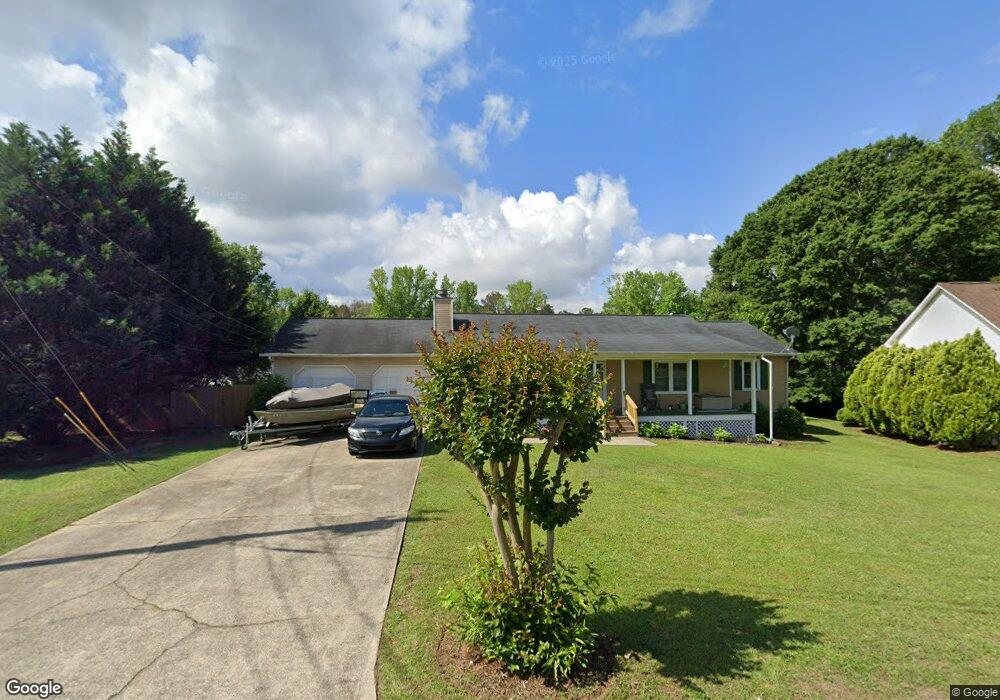
104 Quail Run Carrollton, GA 30116
Estimated Value: $271,000 - $286,000
3
Beds
2
Baths
1,408
Sq Ft
$198/Sq Ft
Est. Value
About This Home
This home is located at 104 Quail Run, Carrollton, GA 30116 and is currently estimated at $278,105, approximately $197 per square foot. 104 Quail Run is a home located in Carroll County with nearby schools including Carrollton Elementary School, Carrollton Upper Elementary School, and Carrollton Middle School.
Ownership History
Date
Name
Owned For
Owner Type
Purchase Details
Closed on
Jun 28, 2016
Sold by
Menke Jennifer J
Bought by
Jens Lorna
Current Estimated Value
Home Financials for this Owner
Home Financials are based on the most recent Mortgage that was taken out on this home.
Original Mortgage
$85,920
Outstanding Balance
$39,089
Interest Rate
3.66%
Mortgage Type
New Conventional
Estimated Equity
$239,016
Purchase Details
Closed on
Mar 15, 2013
Sold by
Charter Bank
Bought by
Menke Jennifer J
Home Financials for this Owner
Home Financials are based on the most recent Mortgage that was taken out on this home.
Original Mortgage
$66,300
Interest Rate
3.57%
Mortgage Type
New Conventional
Purchase Details
Closed on
Jan 2, 2013
Sold by
Charterbank
Bought by
Chartebank
Purchase Details
Closed on
Sep 30, 2004
Sold by
Collins Terry and Collins Kay
Bought by
Stewart Lori D and Stewart James W
Purchase Details
Closed on
Jan 1, 1989
Bought by
Collins
Create a Home Valuation Report for This Property
The Home Valuation Report is an in-depth analysis detailing your home's value as well as a comparison with similar homes in the area
Home Values in the Area
Average Home Value in this Area
Purchase History
| Date | Buyer | Sale Price | Title Company |
|---|---|---|---|
| Jens Lorna | $107,400 | -- | |
| Menke Jennifer J | $78,000 | -- | |
| Chartebank | $122,000 | -- | |
| Stewart Lori D | $130,000 | -- | |
| Collins | -- | -- |
Source: Public Records
Mortgage History
| Date | Status | Borrower | Loan Amount |
|---|---|---|---|
| Open | Jens Lorna | $85,920 | |
| Previous Owner | Menke Jennifer J | $66,300 |
Source: Public Records
Tax History Compared to Growth
Tax History
| Year | Tax Paid | Tax Assessment Tax Assessment Total Assessment is a certain percentage of the fair market value that is determined by local assessors to be the total taxable value of land and additions on the property. | Land | Improvement |
|---|---|---|---|---|
| 2024 | $1,663 | $71,725 | $6,000 | $65,725 |
| 2023 | $1,663 | $65,786 | $6,000 | $59,786 |
| 2022 | $1,352 | $53,942 | $6,000 | $47,942 |
| 2021 | $1,194 | $47,081 | $6,000 | $41,081 |
| 2020 | $1,099 | $42,904 | $6,000 | $36,904 |
| 2019 | $1,038 | $39,830 | $6,000 | $33,830 |
| 2018 | $983 | $36,842 | $6,000 | $30,842 |
| 2017 | $988 | $36,842 | $6,000 | $30,842 |
| 2016 | $1,115 | $36,842 | $6,000 | $30,842 |
| 2015 | $1,229 | $39,790 | $6,000 | $33,790 |
| 2014 | $968 | $33,138 | $6,000 | $27,138 |
Source: Public Records
Map
Nearby Homes
- 131 Hunter Way
- 221 Turtle Cove
- 105 Providence Ct
- 2580 Shady Grove Rd
- 115 N Lake Dr
- 255 Morgan Rd
- The McGinnis Plan at Morgan Landing
- 211 Greystone Dr
- 231 N Lakeshore Dr
- 223 N Lakeshore Dr
- 1890 Shady Grove Rd
- 121 Wilson Cir
- 0 Knight Dr W
- 1711B Bankhead Hwy
- 3 Burns Rd
- 2 Burns Rd
- 816 Stewart St
- 0 Shady Grove Rd Unit 10601173
- 0 Shady Grove Rd Unit 10601172
- 0 Old Airport Rd Unit 10599783
- 106 Quail Run
- 102 Quail Run
- 114 Hunters Way
- 110 Hunters Way
- 108 Hunter Way
- 108 Quail Run
- 122 Hunters Way
- 105 Quail Run
- 101 Hunter Way Unit 36, 34, 33, 56, 43,
- 104 Hunters Way
- 119 Hunter Way
- 104 Hunter Way
- 110 Quail Run
- 115 Hunters Way
- 115 Hunter Way
- 124 Hunters Way
- 203 Farmington Trace
- 205 Farmington Trace
- 119 Hunters Way
- 111 Hunter Way