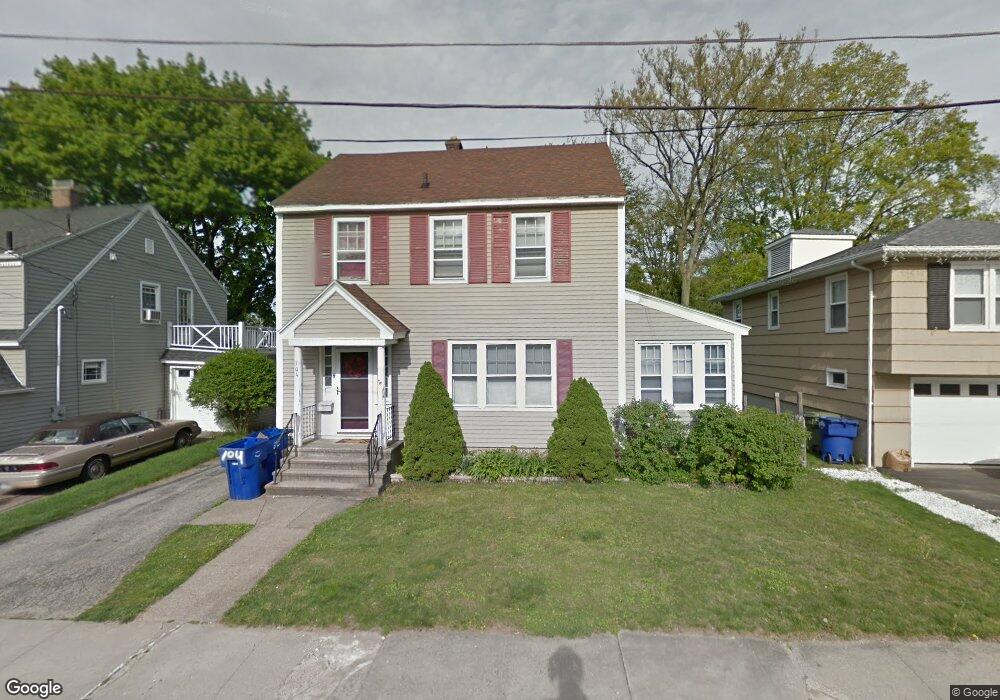
104 Robert St Waterbury, CT 06710
North End District NeighborhoodEstimated Value: $189,000 - $311,000
3
Beds
2
Baths
1,725
Sq Ft
$149/Sq Ft
Est. Value
About This Home
This home is located at 104 Robert St, Waterbury, CT 06710 and is currently estimated at $256,338, approximately $148 per square foot. 104 Robert St is a home located in New Haven County with nearby schools including F. J. Kingsbury School, North End Middle School, and Wilby High School.
Ownership History
Date
Name
Owned For
Owner Type
Purchase Details
Closed on
Jun 16, 2021
Sold by
Quinn Michelle
Bought by
Meyer Rachel
Current Estimated Value
Purchase Details
Closed on
Dec 4, 1992
Sold by
Clow Lawrence and Clow Sandra
Bought by
Topazio Chris and Topazio Danielle
Home Financials for this Owner
Home Financials are based on the most recent Mortgage that was taken out on this home.
Original Mortgage
$110,400
Interest Rate
8.22%
Mortgage Type
Purchase Money Mortgage
Create a Home Valuation Report for This Property
The Home Valuation Report is an in-depth analysis detailing your home's value as well as a comparison with similar homes in the area
Home Values in the Area
Average Home Value in this Area
Purchase History
| Date | Buyer | Sale Price | Title Company |
|---|---|---|---|
| Meyer Rachel | $120,000 | None Available | |
| Topazio Chris | $110,000 | -- |
Source: Public Records
Mortgage History
| Date | Status | Borrower | Loan Amount |
|---|---|---|---|
| Previous Owner | Topazio Chris | $54,650 | |
| Previous Owner | Topazio Chris | $110,400 |
Source: Public Records
Tax History Compared to Growth
Tax History
| Year | Tax Paid | Tax Assessment Tax Assessment Total Assessment is a certain percentage of the fair market value that is determined by local assessors to be the total taxable value of land and additions on the property. | Land | Improvement |
|---|---|---|---|---|
| 2025 | $6,212 | $138,110 | $22,400 | $115,710 |
| 2024 | $6,828 | $138,110 | $22,400 | $115,710 |
| 2023 | $7,484 | $138,110 | $22,400 | $115,710 |
| 2022 | $5,026 | $83,470 | $22,400 | $61,070 |
| 2021 | $5,026 | $83,470 | $22,400 | $61,070 |
| 2020 | $5,026 | $83,470 | $22,400 | $61,070 |
| 2019 | $5,026 | $83,470 | $22,400 | $61,070 |
| 2018 | $5,026 | $83,470 | $22,400 | $61,070 |
| 2017 | $4,890 | $81,220 | $22,400 | $58,820 |
| 2016 | $4,890 | $81,220 | $22,400 | $58,820 |
| 2015 | $4,729 | $81,220 | $22,400 | $58,820 |
| 2014 | $4,729 | $81,220 | $22,400 | $58,820 |
Source: Public Records
Map
Nearby Homes
- 57 Grace Ave
- 52 Herkimer St
- 102 Waverly St
- 3 Herkimer St
- 58 Moran St
- 578 Columbia Boulevard Extension
- 135 Williamson Dr
- 138 Williamson Dr
- 124 Williamson Dr
- 651 Cooke St
- 19 Collins St
- 95 Clinton St
- 74 Macarthur Dr
- 42 Concord St
- 335 Perkins Ave Unit 7
- 96 Dracut Ave
- 468 Perkins Ave
- 307 Dwight St
- 19 Lenox St
- 0 Lonsdale St