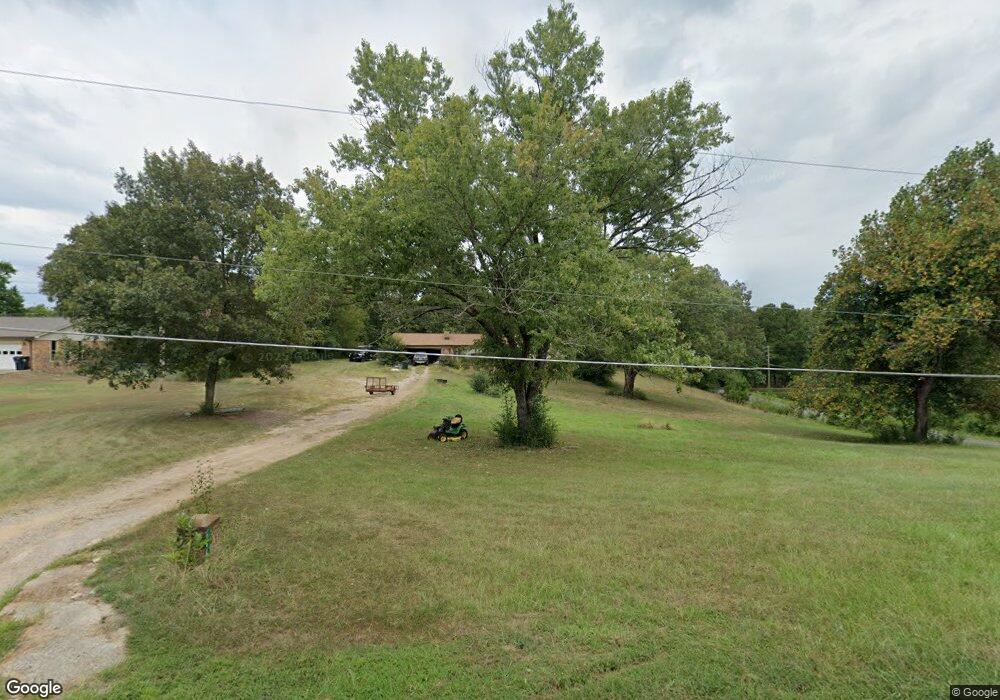
104 Rolling Acres Dr Pearcy, AR 71964
Estimated Value: $177,000 - $263,000
3
Beds
2
Baths
1,568
Sq Ft
$143/Sq Ft
Est. Value
About This Home
This home is located at 104 Rolling Acres Dr, Pearcy, AR 71964 and is currently estimated at $224,914, approximately $143 per square foot. 104 Rolling Acres Dr is a home located in Garland County with nearby schools including Lake Hamilton Primary School, Lake Hamilton Elementary School, and Lake Hamilton Interm. School.
Ownership History
Date
Name
Owned For
Owner Type
Purchase Details
Closed on
Oct 1, 2025
Sold by
Westbrook Debra A
Bought by
Bella Estates Llc
Current Estimated Value
Purchase Details
Closed on
Feb 18, 2011
Sold by
Burkes Anthony D and Burkes Kimberly D
Bought by
Westbrook Debra A
Home Financials for this Owner
Home Financials are based on the most recent Mortgage that was taken out on this home.
Original Mortgage
$134,715
Interest Rate
4.79%
Mortgage Type
New Conventional
Purchase Details
Closed on
Aug 3, 2004
Sold by
Not Provided
Bought by
Burkes Anthony D and Burkes Kimberly D
Purchase Details
Closed on
Jan 20, 2004
Sold by
Not Provided
Bought by
Wells Fargo Home Mtg Inc
Purchase Details
Closed on
Aug 30, 2000
Sold by
Not Provided
Bought by
Crone Stephen R and Crone Leslie
Purchase Details
Closed on
Jul 31, 1992
Sold by
Not Provided
Bought by
Arguello Robert L and Arguello Rebecca A
Create a Home Valuation Report for This Property
The Home Valuation Report is an in-depth analysis detailing your home's value as well as a comparison with similar homes in the area
Home Values in the Area
Average Home Value in this Area
Purchase History
| Date | Buyer | Sale Price | Title Company |
|---|---|---|---|
| Bella Estates Llc | $165,000 | Garland County Title | |
| Westbrook Debra A | $130,000 | Lenders Title Co | |
| Burkes Anthony D | $98,000 | -- | |
| Wells Fargo Home Mtg Inc | -- | -- | |
| Crone Stephen R | $125,000 | -- | |
| Arguello Robert L | $72,999 | -- |
Source: Public Records
Mortgage History
| Date | Status | Borrower | Loan Amount |
|---|---|---|---|
| Previous Owner | Westbrook Debra A | $134,715 |
Source: Public Records
Tax History
| Year | Tax Paid | Tax Assessment Tax Assessment Total Assessment is a certain percentage of the fair market value that is determined by local assessors to be the total taxable value of land and additions on the property. | Land | Improvement |
|---|---|---|---|---|
| 2025 | $601 | $41,310 | $5,440 | $35,870 |
| 2024 | $684 | $41,310 | $5,440 | $35,870 |
| 2023 | $759 | $41,310 | $5,440 | $35,870 |
| 2022 | $1,259 | $41,310 | $5,440 | $35,870 |
| 2021 | $1,255 | $27,040 | $3,280 | $23,760 |
| 2020 | $880 | $27,040 | $3,280 | $23,760 |
| 2019 | $820 | $27,040 | $3,280 | $23,760 |
| 2018 | $845 | $27,040 | $3,280 | $23,760 |
| 2017 | $845 | $27,040 | $3,280 | $23,760 |
| 2016 | $856 | $27,290 | $4,460 | $22,830 |
| 2015 | $856 | $27,290 | $4,460 | $22,830 |
| 2014 | $856 | $27,290 | $4,460 | $22,830 |
Source: Public Records
Map
Nearby Homes
- 105 Rolling Acres Ct
- 173 Memorial Ln
- 214 S Ross Maddox Rd
- 228 Fox Chase Cir
- 209 Fox Chase Cir
- 230 S Ross Maddox Rd
- 3370 Airport Rd
- 218 Charming Heights Dr
- 3478 Airport Rd
- 5701 Sunshine Rd Unit B
- 111 Pelham Place
- 101 Songer
- 209 Fortress Ln
- 222 Rolling Trail
- TBD Airport Hwy
- 201 Shelly Ln
- 260 Wagonwheel Terrace
- 196 Jackson Manor Ct
- 198 Shelly Ln
- 198 Lake Forest Shores Dr
- 108 Rolling Acres Dr
- 425 N Ross Maddox Rd
- 120 Rolling Acres Dr
- 103 Rolling Acres Dr
- 424 N Ross Maddox Rd
- 512 N Ross Maddox Rd
- 435 N Ross Maddox Rd
- 111 Rolling Acres Dr
- 206 Rolling Acres Dr
- 125 Sundance Trail
- 121 Sundance Trail
- 121 Sundance Trail Unit 121 Sundance Trail
- 307 N Ross Maddox Rd
- 119 Rolling Acres Dr
- 124 Caraway Terrace
- 439 N Ross Maddox Rd
- 112 Donald Ln
- 118 Caraway Terrace
- 118 Caraway Terrace Unit A & B
- 118 Caraway Terrace Unit A&B
Your Personal Tour Guide
Ask me questions while you tour the home.