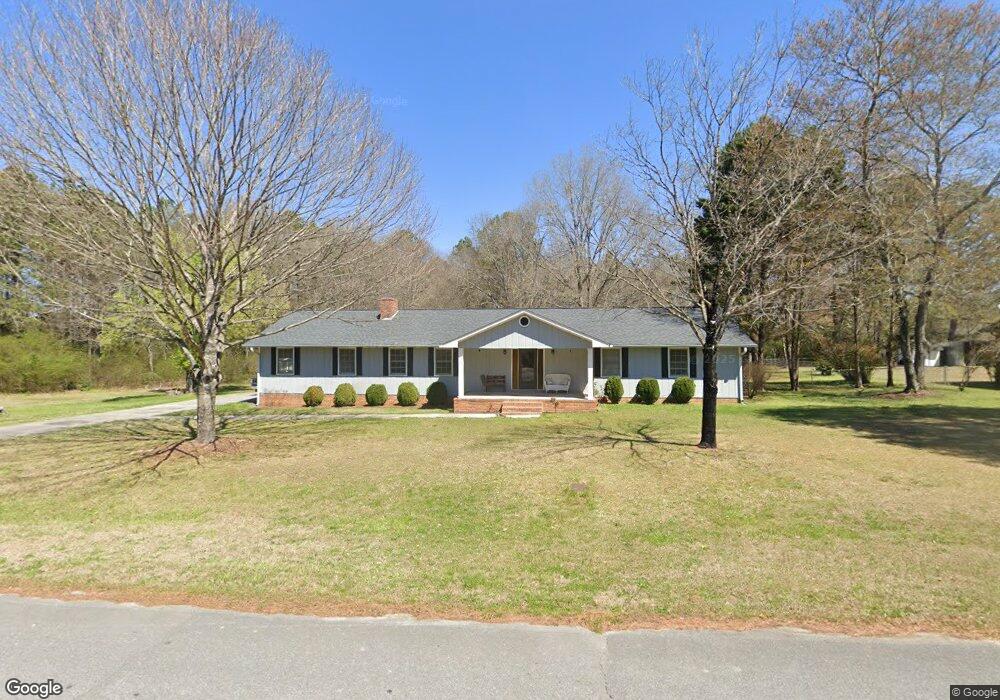
104 Rolling Hills Rd Cedartown, GA 30125
Estimated Value: $226,000 - $290,000
3
Beds
2
Baths
1,870
Sq Ft
$141/Sq Ft
Est. Value
About This Home
This home is located at 104 Rolling Hills Rd, Cedartown, GA 30125 and is currently estimated at $263,904, approximately $141 per square foot. 104 Rolling Hills Rd is a home located in Polk County with nearby schools including Cedar Christian School.
Ownership History
Date
Name
Owned For
Owner Type
Purchase Details
Closed on
Oct 2, 2007
Sold by
Allen Jo Ann
Bought by
Allen Randy E
Current Estimated Value
Purchase Details
Closed on
Jun 18, 2004
Sold by
Allen Randy E
Bought by
Allen Jo Ann
Purchase Details
Closed on
Mar 18, 2004
Sold by
Allen Randy E
Bought by
Allen Jo Ann
Purchase Details
Closed on
Sep 16, 1980
Sold by
Palmer Jerry Wayne
Bought by
Allen Randy and Jo Ann
Purchase Details
Closed on
Jul 10, 1980
Sold by
Palmer Palmer J and Palmer Vicki
Bought by
Palmer Jerry Wayne
Purchase Details
Closed on
Feb 3, 1979
Sold by
Thomas Joe
Bought by
Palmer Palmer J and Palmer Vicki
Purchase Details
Closed on
Sep 19, 1978
Bought by
Thomas Joe
Create a Home Valuation Report for This Property
The Home Valuation Report is an in-depth analysis detailing your home's value as well as a comparison with similar homes in the area
Home Values in the Area
Average Home Value in this Area
Purchase History
| Date | Buyer | Sale Price | Title Company |
|---|---|---|---|
| Allen Randy E | -- | -- | |
| Allen Jo Ann | -- | -- | |
| Allen Jo Ann | -- | -- | |
| Allen Randy | -- | -- | |
| Palmer Jerry Wayne | -- | -- | |
| Palmer Palmer J | -- | -- | |
| Thomas Joe | -- | -- |
Source: Public Records
Tax History Compared to Growth
Tax History
| Year | Tax Paid | Tax Assessment Tax Assessment Total Assessment is a certain percentage of the fair market value that is determined by local assessors to be the total taxable value of land and additions on the property. | Land | Improvement |
|---|---|---|---|---|
| 2024 | $1,925 | $94,111 | $12,000 | $82,111 |
| 2023 | $1,384 | $60,303 | $8,000 | $52,303 |
| 2022 | $1,316 | $57,451 | $12,600 | $44,851 |
| 2021 | $1,333 | $57,451 | $12,600 | $44,851 |
| 2020 | $1,336 | $57,451 | $12,600 | $44,851 |
| 2019 | $965 | $37,921 | $4,000 | $33,921 |
| 2018 | $919 | $35,344 | $5,558 | $29,786 |
| 2017 | $907 | $35,344 | $5,558 | $29,786 |
| 2016 | $907 | $35,344 | $5,558 | $29,786 |
| 2015 | $919 | $35,666 | $5,558 | $30,109 |
| 2014 | $943 | $34,288 | $6,112 | $28,176 |
Source: Public Records
Map
Nearby Homes
- 106 Rolling Hills Rd
- 103 Rolling Hills Rd Unit 38
- 103 Rolling Hills Rd
- 0 Rolling Hills Unit 9063787
- 101 Rolling Hills Rd
- 105 Rolling Hills Rd
- 105 Rollinghill
- 107 Rolling Hills Rd
- 50 Woodglen Dr
- 60 Woodglen Dr
- 40 Woodglen Dr
- 300 Greenview Ct
- 304 Greenview Ct
- 70 Woodglen Dr
- 30 Woodglen Dr
- 111 Rolling Hills Rd
- 0 Woodglen Dr Unit 7504358
- 0 Woodglen Dr Unit 3266485
- 0 Woodglen Dr
- 80 Woodglen Dr