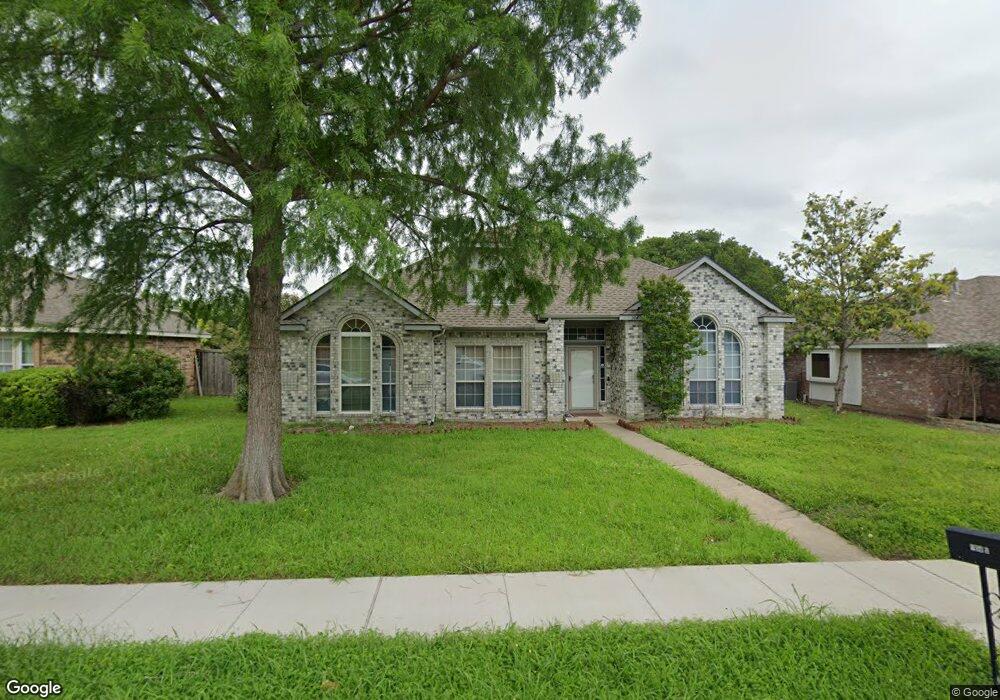
Estimated Value: $352,138 - $415,000
3
Beds
2
Baths
2,274
Sq Ft
$173/Sq Ft
Est. Value
About This Home
This home is located at 104 S Carriage House Way, Wylie, TX 75098 and is currently estimated at $392,535, approximately $172 per square foot. 104 S Carriage House Way is a home located in Collin County with nearby schools including T.F. Birmingham Elementary School, Frank Mcmillan Junior High School, and Davis Intermediate School.
Ownership History
Date
Name
Owned For
Owner Type
Purchase Details
Closed on
Jun 11, 2014
Sold by
Finnerty Robert G
Bought by
Cullen Finnerty Revocable Family Trust
Current Estimated Value
Purchase Details
Closed on
May 9, 1997
Sold by
Anthony Dale and Cheatham Deeann Levar
Bought by
Finnerty Robert G
Purchase Details
Closed on
Apr 26, 1996
Sold by
Kozicki Raymond J and Kozicki Mary E
Bought by
Cheatham Dale A and Cheatham Deeann L
Home Financials for this Owner
Home Financials are based on the most recent Mortgage that was taken out on this home.
Original Mortgage
$114,852
Interest Rate
7.78%
Mortgage Type
VA
Purchase Details
Closed on
Feb 24, 1995
Sold by
Circuit City Stores Inc
Bought by
Kozicki Raymond J and Kozicki Mary E
Home Financials for this Owner
Home Financials are based on the most recent Mortgage that was taken out on this home.
Original Mortgage
$90,000
Interest Rate
7.5%
Create a Home Valuation Report for This Property
The Home Valuation Report is an in-depth analysis detailing your home's value as well as a comparison with similar homes in the area
Home Values in the Area
Average Home Value in this Area
Purchase History
| Date | Buyer | Sale Price | Title Company |
|---|---|---|---|
| Cullen Finnerty Revocable Family Trust | -- | None Available | |
| Finnerty Robert G | -- | -- | |
| Cheatham Dale A | -- | -- | |
| Kozicki Raymond J | -- | -- |
Source: Public Records
Mortgage History
| Date | Status | Borrower | Loan Amount |
|---|---|---|---|
| Previous Owner | Cheatham Dale A | $114,852 | |
| Previous Owner | Kozicki Raymond J | $90,000 | |
| Closed | Finnerty Robert G | $0 |
Source: Public Records
Tax History Compared to Growth
Tax History
| Year | Tax Paid | Tax Assessment Tax Assessment Total Assessment is a certain percentage of the fair market value that is determined by local assessors to be the total taxable value of land and additions on the property. | Land | Improvement |
|---|---|---|---|---|
| 2025 | $7,031 | $376,875 | $95,000 | $281,875 |
| 2024 | $7,031 | $375,539 | $95,000 | $260,982 |
| 2023 | $7,031 | $339,214 | $85,000 | $254,214 |
| 2022 | $7,068 | $322,168 | $85,000 | $237,168 |
| 2021 | $6,084 | $258,582 | $70,000 | $188,582 |
| 2020 | $6,371 | $256,580 | $55,000 | $201,580 |
| 2019 | $6,507 | $247,629 | $55,000 | $192,629 |
| 2018 | $6,275 | $232,991 | $55,000 | $177,991 |
| 2017 | $5,503 | $204,355 | $50,000 | $154,355 |
| 2016 | $5,501 | $197,982 | $40,000 | $157,982 |
| 2015 | $4,035 | $171,482 | $35,000 | $136,482 |
Source: Public Records
Map
Nearby Homes
- 107 N Winding Oaks Dr
- 115 Pullman Place
- 420 W Oak St
- 310 Austin Ave
- 708 Andersonville Ln
- 314 Stephanie St
- 315 Celia Cir
- 404 W Jefferson St
- 300 S Cottonbelt Ave Unit 3A
- 205 S Cottonbelt Ave
- 111 N Keefer Dr
- 307 W Brown St
- 309 Sikorsky Ct
- 410 Oxford Dr
- 410 N Winding Oaks Dr
- 913 Chickesaw Ln
- 804 Memorial Dr
- 415 Carver Dr
- 423 N Winding Oaks Dr
- 907 Carlton Rd
- 102 S Carriage House Way
- 106 S Carriage House Way
- 108 S Carriage House Way
- 100 S Carriage House Way
- 600 Andersonville Ln
- 506 Silverleaf Ct
- 504 Silverleaf Ct
- 509 W Oak St
- 601 W Oak St
- 110 S Carriage House Way
- 507 W Oak St
- 601 Andersonville Ln
- 505 Silverleaf Ct
- 602 Andersonville Ln
- 502 Silverleaf Ct
- 505 W Oak St
- 112 S Carriage House Way
- 603 W Oak St
- 603 Andersonville Ln
- 604 Andersonville Ln