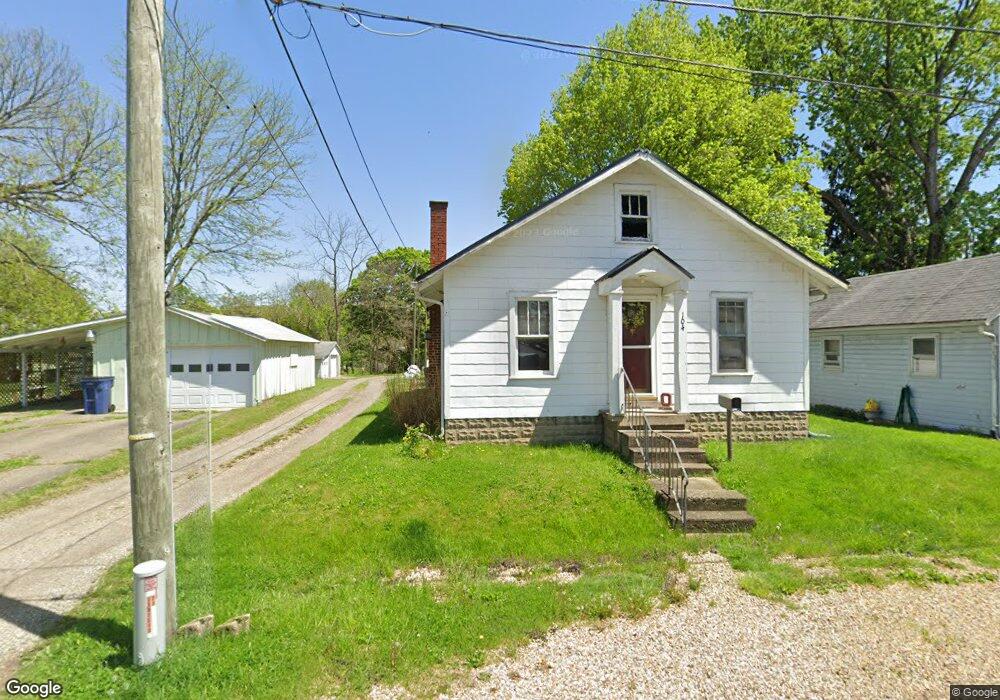
104 S Center St Mount Vernon, OH 43050
Estimated Value: $96,123 - $177,000
1
Bed
1
Bath
476
Sq Ft
$265/Sq Ft
Est. Value
About This Home
This home is located at 104 S Center St, Mount Vernon, OH 43050 and is currently estimated at $126,031, approximately $264 per square foot. 104 S Center St is a home located in Knox County with nearby schools including Mount Vernon High School, St. Vincent de Paul School, and Christian Star Academy.
Ownership History
Date
Name
Owned For
Owner Type
Purchase Details
Closed on
Dec 16, 2020
Sold by
Gtb Rentals & Investments Llc
Bought by
Green'S Rentals & Real Estate Llc
Current Estimated Value
Home Financials for this Owner
Home Financials are based on the most recent Mortgage that was taken out on this home.
Interest Rate
2.71%
Purchase Details
Closed on
Jun 9, 2010
Sold by
Mast Clara
Bought by
Gtb Rentals & Investments Llc
Home Financials for this Owner
Home Financials are based on the most recent Mortgage that was taken out on this home.
Original Mortgage
$20,000
Interest Rate
5.13%
Mortgage Type
Future Advance Clause Open End Mortgage
Purchase Details
Closed on
Jul 7, 1998
Sold by
Wolford Anna W
Bought by
Mast Clara
Purchase Details
Closed on
Jan 17, 1992
Sold by
Duckworth Charles W and Duckworth Vel
Bought by
Wolford Anna W
Create a Home Valuation Report for This Property
The Home Valuation Report is an in-depth analysis detailing your home's value as well as a comparison with similar homes in the area
Home Values in the Area
Average Home Value in this Area
Purchase History
| Date | Buyer | Sale Price | Title Company |
|---|---|---|---|
| Green'S Rentals & Real Estate Llc | $49,700 | -- | |
| Gtb Rentals & Investments Llc | $18,750 | None Available | |
| Mast Clara | $22,000 | -- | |
| Wolford Anna W | $15,000 | -- |
Source: Public Records
Mortgage History
| Date | Status | Borrower | Loan Amount |
|---|---|---|---|
| Closed | Green'S Rentals & Real Estate Llc | -- | |
| Previous Owner | Gtb Rentals & Investments Llc | $20,000 |
Source: Public Records
Tax History Compared to Growth
Tax History
| Year | Tax Paid | Tax Assessment Tax Assessment Total Assessment is a certain percentage of the fair market value that is determined by local assessors to be the total taxable value of land and additions on the property. | Land | Improvement |
|---|---|---|---|---|
| 2024 | $548 | $13,810 | $3,050 | $10,760 |
| 2023 | $548 | $13,810 | $3,050 | $10,760 |
| 2022 | $418 | $9,520 | $2,100 | $7,420 |
| 2021 | $418 | $9,520 | $2,100 | $7,420 |
| 2020 | $408 | $9,520 | $2,100 | $7,420 |
| 2019 | $491 | $10,720 | $2,840 | $7,880 |
| 2018 | $492 | $10,720 | $2,840 | $7,880 |
| 2017 | $484 | $10,720 | $2,840 | $7,880 |
| 2016 | $449 | $9,920 | $2,630 | $7,290 |
| 2015 | $451 | $9,920 | $2,630 | $7,290 |
| 2014 | $453 | $9,920 | $2,630 | $7,290 |
| 2013 | $460 | $9,490 | $2,560 | $6,930 |
Source: Public Records
Map
Nearby Homes