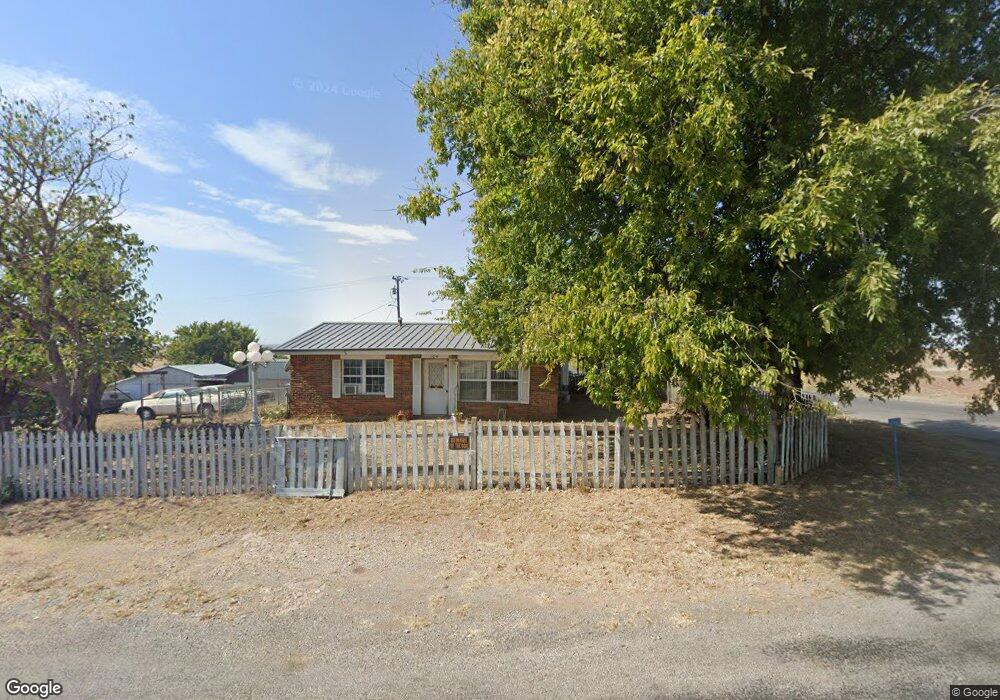
104 S Hilltop Rd Apache, OK 73006
Estimated Value: $88,000 - $152,000
3
Beds
2
Baths
1,560
Sq Ft
$75/Sq Ft
Est. Value
About This Home
This home is located at 104 S Hilltop Rd, Apache, OK 73006 and is currently estimated at $117,446, approximately $75 per square foot. 104 S Hilltop Rd is a home located in Comanche County with nearby schools including Elgin Elementary School, Elgin Middle School, and Elgin High School.
Ownership History
Date
Name
Owned For
Owner Type
Purchase Details
Closed on
Oct 9, 2013
Sold by
Shafer James and Shafer Deanna
Bought by
Lindsey Edward D
Current Estimated Value
Purchase Details
Closed on
Apr 23, 2012
Sold by
Young Lela Mae Hunt
Bought by
Reverse Mortgage Solutions Inc
Purchase Details
Closed on
Apr 30, 2008
Sold by
Young Lela Mae
Bought by
Young Lela Mae
Purchase Details
Closed on
Nov 20, 2007
Sold by
Hunt Gregg M
Bought by
Young Lela Mae Hunt
Home Financials for this Owner
Home Financials are based on the most recent Mortgage that was taken out on this home.
Original Mortgage
$123,000
Interest Rate
4.97%
Mortgage Type
Reverse Mortgage Home Equity Conversion Mortgage
Purchase Details
Closed on
Dec 2, 2005
Sold by
Young Lela Mae Hunt
Bought by
Young Lela Mae Hunt and Hunt Gregg M
Purchase Details
Closed on
Jun 5, 1996
Sold by
Young Bobby J
Create a Home Valuation Report for This Property
The Home Valuation Report is an in-depth analysis detailing your home's value as well as a comparison with similar homes in the area
Purchase History
| Date | Buyer | Sale Price | Title Company |
|---|---|---|---|
| Lindsey Edward D | -- | -- | |
| Reverse Mortgage Solutions Inc | -- | None Available | |
| Young Lela Mae | -- | None Available | |
| Young Lela Mae Hunt | -- | -- | |
| Young Lela Mae Hunt | -- | -- | |
| -- | -- | -- |
Source: Public Records
Mortgage History
| Date | Status | Borrower | Loan Amount |
|---|---|---|---|
| Previous Owner | Young Lela Mae Hunt | $123,000 |
Source: Public Records
Tax History
| Year | Tax Paid | Tax Assessment Tax Assessment Total Assessment is a certain percentage of the fair market value that is determined by local assessors to be the total taxable value of land and additions on the property. | Land | Improvement |
|---|---|---|---|---|
| 2025 | $619 | $6,128 | $169 | $5,959 |
| 2024 | $613 | $6,128 | $169 | $5,959 |
| 2023 | $613 | $5,558 | $169 | $5,389 |
| 2022 | $583 | $5,558 | $169 | $5,389 |
| 2021 | $594 | $5,571 | $169 | $5,402 |
| 2020 | $561 | $5,575 | $169 | $5,406 |
| 2019 | $579 | $5,310 | $169 | $5,141 |
| 2018 | $550 | $5,057 | $169 | $4,888 |
| 2017 | $501 | $4,816 | $169 | $4,647 |
| 2016 | $473 | $4,587 | $169 | $4,418 |
| 2015 | $449 | $4,368 | $169 | $4,199 |
| 2014 | $440 | $4,368 | $169 | $4,199 |
Source: Public Records
Map
Nearby Homes
- TBD Hilltop Rd
- 115 N Brookdale
- 116 N Lakeside Dr
- 120 NE Kiowa Rd
- 207 N Hillside Rd
- 1100 NE King Rd
- 67 Ash Ave
- 124 Ellsworth Dr
- 13872 NW Stoney Point Rd
- 12568 Pinnacle Ln
- 13145 NE Clearwater Cir
- 13473 NE Tony Creek Rd
- 3438 Mesa Dr
- 12838 Pinnacle Ln
- 12654 Pinnacle Ln
- 12065 Big Horn Ln
- 13195 NE Tony Creek Rd
- 4255 Peak Ln
- 104 London Dr
- 7655 Northgate Dr
- 108 S Hilltop Rd
- 114 S Hilltop Rd
- 111 S Hilltop Rd
- 116 S Hilltop Rd
- 116 S Hilltop Rd
- 112 N Hilltop Rd
- 112 S Hilltop Rd
- 106 S Lakeview Rd
- 119 S Hilltop Rd
- 123 S Lakeview Rd
- 103 Lakeview Ave
- 120 N Hilltop Rd
- 109 S Lakeview Rd
- 122 Lakeview Ave
- TBD Lakeview Dr
- 112 N Hillside Rd
- 104 Circle Dr
- 104 Circle Dr
- 118 S Hillside Rd
- 127 S Hilltop Rd
Your Personal Tour Guide
Ask me questions while you tour the home.