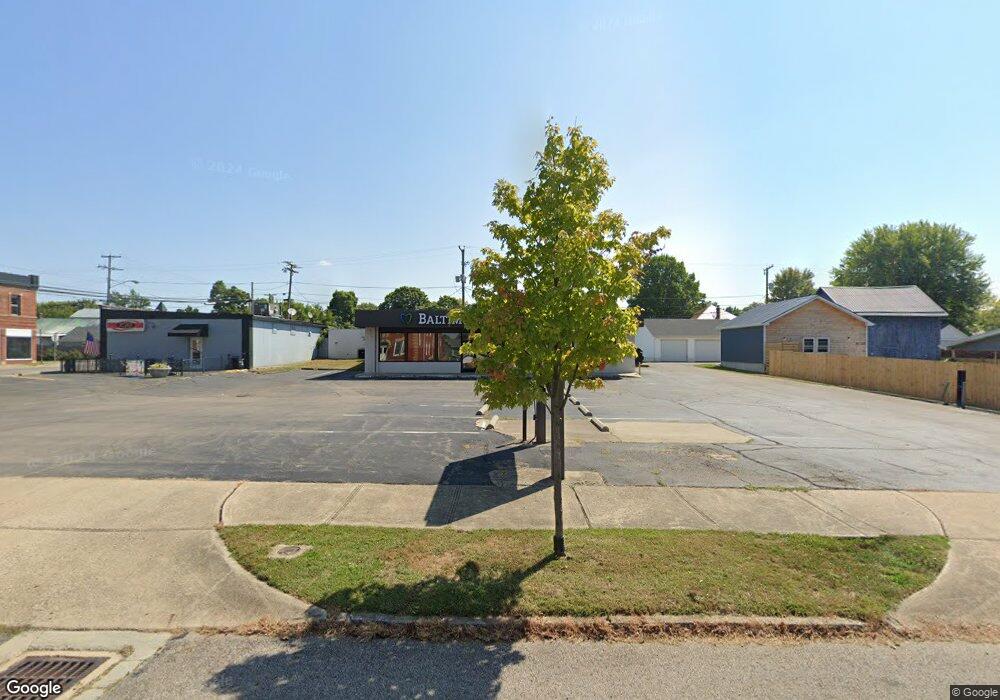
104 S Main St Baltimore, OH 43105
Estimated Value: $294,000
--
Bed
--
Bath
2,668
Sq Ft
$110/Sq Ft
Est. Value
About This Home
This home is located at 104 S Main St, Baltimore, OH 43105 and is currently priced at $294,000, approximately $110 per square foot. 104 S Main St is a home located in Fairfield County with nearby schools including Liberty Union Elementary School, Liberty Union Middle School, and Liberty Union High School.
Ownership History
Date
Name
Owned For
Owner Type
Purchase Details
Closed on
Feb 17, 2016
Sold by
Jama Brookside Llc
Bought by
Pk Real Estate Inc
Current Estimated Value
Purchase Details
Closed on
Jul 1, 2014
Sold by
Hodge Vinton D and Hodge Marilyn J
Bought by
Jama Brookside Llc
Home Financials for this Owner
Home Financials are based on the most recent Mortgage that was taken out on this home.
Original Mortgage
$340,000
Interest Rate
3.21%
Mortgage Type
Commercial
Purchase Details
Closed on
Dec 2, 2011
Sold by
104 South Main Llc
Bought by
Hodge Vinton D and Hodge Marilyn J
Home Financials for this Owner
Home Financials are based on the most recent Mortgage that was taken out on this home.
Original Mortgage
$50,000
Interest Rate
4.01%
Mortgage Type
Future Advance Clause Open End Mortgage
Create a Home Valuation Report for This Property
The Home Valuation Report is an in-depth analysis detailing your home's value as well as a comparison with similar homes in the area
Home Values in the Area
Average Home Value in this Area
Purchase History
| Date | Buyer | Sale Price | Title Company |
|---|---|---|---|
| Pk Real Estate Inc | $375,000 | None Available | |
| Jama Brookside Llc | $289,000 | Attorney | |
| Hodge Vinton D | $120,000 | Attorney |
Source: Public Records
Mortgage History
| Date | Status | Borrower | Loan Amount |
|---|---|---|---|
| Open | Pk Real Estate Inc | $375,000 | |
| Previous Owner | Jama Brookside Llc | $340,000 | |
| Previous Owner | Hodge Marilyn J | $50,000 | |
| Previous Owner | Hodge Vinton D | $60,000 |
Source: Public Records
Tax History Compared to Growth
Tax History
| Year | Tax Paid | Tax Assessment Tax Assessment Total Assessment is a certain percentage of the fair market value that is determined by local assessors to be the total taxable value of land and additions on the property. | Land | Improvement |
|---|---|---|---|---|
| 2024 | $6,420 | $85,520 | $17,340 | $68,180 |
| 2023 | $4,521 | $85,520 | $17,340 | $68,180 |
| 2022 | $4,485 | $85,520 | $17,340 | $68,180 |
| 2021 | $4,475 | $83,880 | $15,700 | $68,180 |
| 2020 | $4,599 | $83,880 | $15,700 | $68,180 |
| 2019 | $4,709 | $83,880 | $15,700 | $68,180 |
| 2018 | $4,781 | $84,070 | $15,700 | $68,370 |
| 2017 | $4,781 | $83,530 | $15,700 | $67,830 |
| 2016 | $4,717 | $83,530 | $15,700 | $67,830 |
| 2015 | $2,343 | $43,880 | $15,700 | $28,180 |
| 2014 | $2,261 | $43,880 | $15,700 | $28,180 |
| 2013 | $2,261 | $43,880 | $15,700 | $28,180 |
Source: Public Records
Map
Nearby Homes
- 214 E Cliff St
- 101 Circle Dr
- 606 N Main St
- 224 Baltimore Somerset Rd NE
- 133 N Creekview Ct
- 111 N High St
- 0 S Company St Unit Lot 2 225029545
- 0 S Company St Unit Lot 1 225029543
- 570 Baltimore Somerset Rd NE Unit Lot 1
- 1350 Leonard Rd NW
- 1502 Leonard Rd NW
- 9730 Lancaster-Kirkersville Rd NW
- 0 Lancaster-Newark Rd NE
- 9915 Lancaster-Newark Rd NE
- 8061 Maple St
- 8095 High St
- 8101 High St
- 5870 Brook Rd NW
- 2161 E Main St
- 1590 Stemen Rd NW