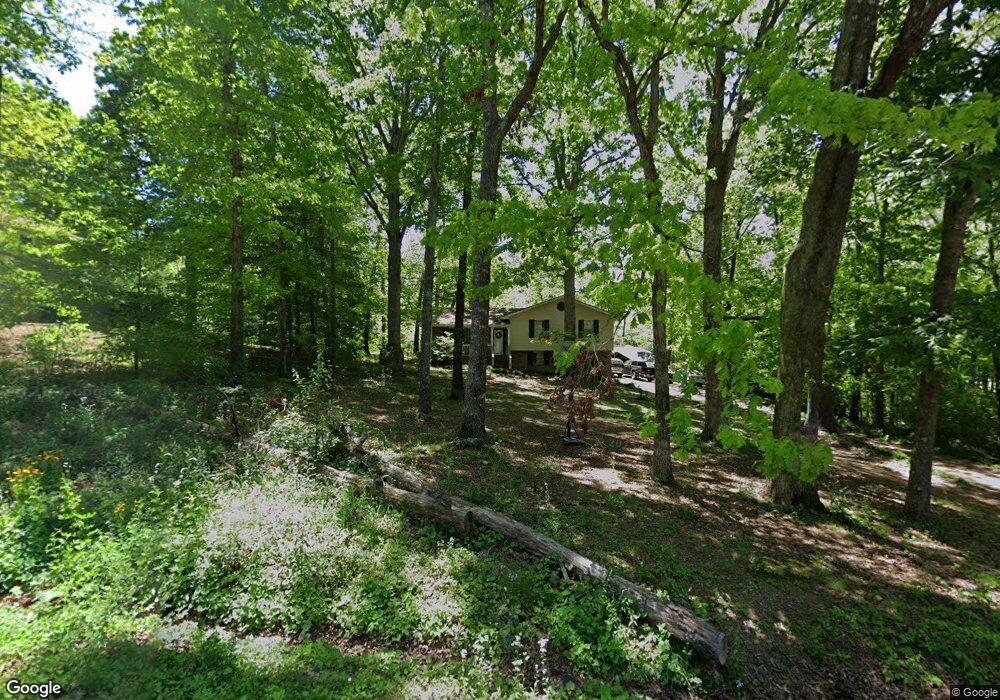
104 S Oakland Dr Unit AA La Fayette, GA 30728
Estimated Value: $197,000 - $225,000
--
Bed
2
Baths
1,206
Sq Ft
$176/Sq Ft
Est. Value
About This Home
This home is located at 104 S Oakland Dr Unit AA, La Fayette, GA 30728 and is currently estimated at $211,744, approximately $175 per square foot. 104 S Oakland Dr Unit AA is a home located in Walker County with nearby schools including Gilbert Elementary School, Lafayette Middle School, and Lafayette High School.
Ownership History
Date
Name
Owned For
Owner Type
Purchase Details
Closed on
Apr 20, 2012
Sold by
Ftj Investments Llc
Bought by
Clark Tracy
Current Estimated Value
Home Financials for this Owner
Home Financials are based on the most recent Mortgage that was taken out on this home.
Original Mortgage
$73,367
Outstanding Balance
$51,198
Interest Rate
4.13%
Mortgage Type
New Conventional
Estimated Equity
$160,546
Purchase Details
Closed on
Dec 30, 2011
Sold by
Caheely Freddy
Purchase Details
Closed on
Sep 6, 2011
Sold by
Bank Of America
Bought by
Federal Home Loan
Purchase Details
Closed on
Oct 29, 2004
Sold by
Wills Stephen M and Dora Anne
Bought by
Wills Stephen M
Purchase Details
Closed on
Sep 6, 1995
Sold by
Hankins Pat H
Bought by
Wills Stephen M and Dora Anne
Purchase Details
Closed on
Jun 19, 1985
Sold by
Brooks Luther R
Bought by
Hankins Pat H
Purchase Details
Closed on
Jun 5, 1978
Sold by
Lay Paul J and Lay Martha M
Bought by
Brooks Luther R
Purchase Details
Closed on
Jun 20, 1974
Sold by
Wright Thomas E
Bought by
Lay Paul J and Lay Martha M
Purchase Details
Closed on
Mar 14, 1974
Bought by
Wright Thomas E
Create a Home Valuation Report for This Property
The Home Valuation Report is an in-depth analysis detailing your home's value as well as a comparison with similar homes in the area
Home Values in the Area
Average Home Value in this Area
Purchase History
| Date | Buyer | Sale Price | Title Company |
|---|---|---|---|
| Clark Tracy | $71,900 | -- | |
| -- | -- | -- | |
| Federal Home Loan | $72,457 | -- | |
| Bank Of America | $72,457 | -- | |
| Wills Stephen M | -- | -- | |
| Wills Stephen M | $66,500 | -- | |
| Hankins Pat H | $39,500 | -- | |
| Brooks Luther R | -- | -- | |
| Lay Paul J | -- | -- | |
| Wright Thomas E | -- | -- |
Source: Public Records
Mortgage History
| Date | Status | Borrower | Loan Amount |
|---|---|---|---|
| Open | Clark Tracy | $73,367 |
Source: Public Records
Tax History Compared to Growth
Tax History
| Year | Tax Paid | Tax Assessment Tax Assessment Total Assessment is a certain percentage of the fair market value that is determined by local assessors to be the total taxable value of land and additions on the property. | Land | Improvement |
|---|---|---|---|---|
| 2024 | $1,601 | $70,502 | $3,762 | $66,740 |
| 2023 | $1,555 | $66,895 | $3,762 | $63,133 |
| 2022 | $1,464 | $57,807 | $3,762 | $54,045 |
| 2021 | $1,153 | $40,142 | $3,762 | $36,380 |
| 2020 | $1,020 | $33,683 | $3,762 | $29,921 |
| 2019 | $1,037 | $33,683 | $3,762 | $29,921 |
| 2018 | $891 | $33,683 | $3,762 | $29,921 |
| 2017 | $1,080 | $32,040 | $3,960 | $28,080 |
| 2016 | $914 | $32,040 | $3,960 | $28,080 |
| 2015 | $962 | $31,942 | $4,000 | $27,942 |
| 2014 | $871 | $31,942 | $4,000 | $27,942 |
| 2013 | -- | $31,941 | $4,000 | $27,941 |
Source: Public Records
Map
Nearby Homes
- 334 S Oakland Dr
- 300 Bronco Rd
- 1152 Magnolia St
- 1103 Sisemore St
- 24605 Highway 193
- 1125 S Chattanooga St
- 308 Pledger Pkwy
- 39 Cook St
- 221 Chota Cir
- 100 Lake Terrace Dr
- Perry Plan at Lake Terrace
- Sullivan Plan at Lake Terrace
- Lewis Plan at Lake Terrace
- Curtis Plan at Lake Terrace
- Edmon Plan at Lake Terrace
- Wyeth Plan at Lake Terrace
- 908 Gilbert Ln
- 1002 Colerain St
- 1314 W Main St
- 0 Indiana St Unit 28 10583802
- 104 S Oakland Dr
- 100 S Oakland Dr
- 110 S Oakland Dr
- 28 S Oakland Dr
- 1107 S Burnt Mill Rd
- 120 S Oakland Dr
- 27 S Oakland Dr
- 27 S Oakland Dr
- 81 S Oakland Dr
- 101 S Oakland Dr
- 161 S Oakland Dr
- 1114 S Burnt Mill Rd
- 142 S Oakland Dr
- 1018 S Burnt Mill Rd
- 1017 S Burnt Mill Rd
- 0 S Oakland Dr Unit 931824
- 0 S Oakland Dr
- 18 Red Oak Dr
- 1001 S Burnt Mill Rd
- 106 Red Oak Dr