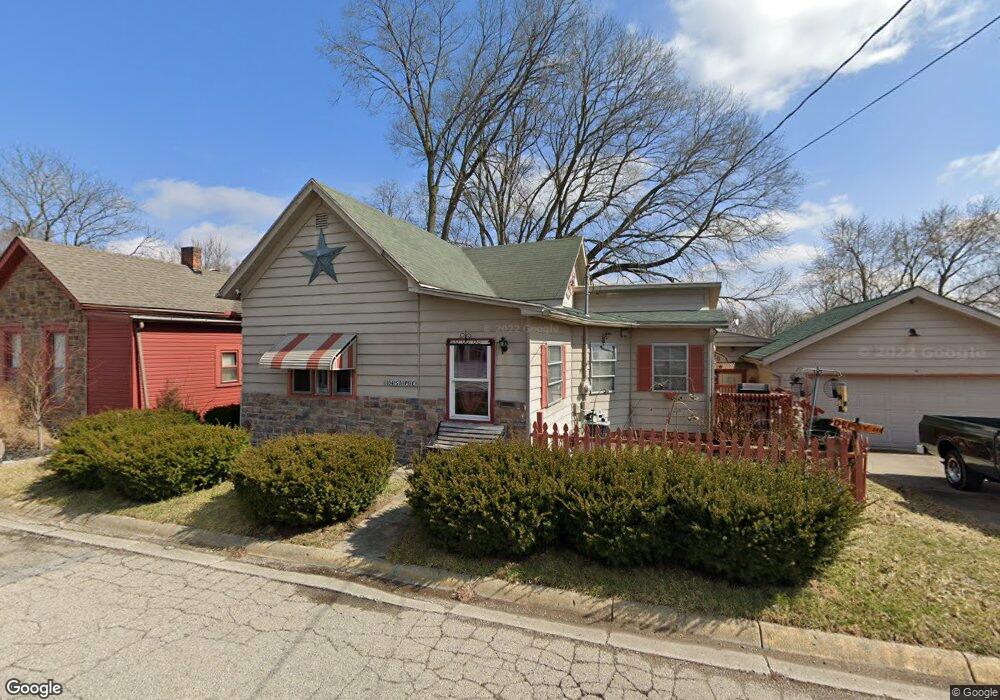
104 S Pike St New Carlisle, OH 45344
Estimated Value: $117,000 - $187,000
2
Beds
1
Bath
1,950
Sq Ft
$86/Sq Ft
Est. Value
About This Home
This home is located at 104 S Pike St, New Carlisle, OH 45344 and is currently estimated at $168,524, approximately $86 per square foot. 104 S Pike St is a home located in Clark County with nearby schools including New Carlisle Elementary School, Park Layne Elementary School, and Donnelsville Elementary School.
Ownership History
Date
Name
Owned For
Owner Type
Purchase Details
Closed on
Oct 25, 2008
Sold by
Growney Mary
Bought by
Cantrell Charles
Current Estimated Value
Purchase Details
Closed on
Jun 6, 2006
Sold by
Federal Home Loan Mortgage Corporation
Bought by
Cantrell Charles and Growney Mary
Home Financials for this Owner
Home Financials are based on the most recent Mortgage that was taken out on this home.
Original Mortgage
$62,500
Interest Rate
6.73%
Mortgage Type
Purchase Money Mortgage
Purchase Details
Closed on
Oct 21, 2005
Sold by
Ferber Denise G and Countrywide Home Loans Inc
Bought by
Federal Home Loan Mortgage Corporation
Purchase Details
Closed on
Sep 6, 1996
Sold by
Greil Fred
Bought by
Denise G Ferber
Home Financials for this Owner
Home Financials are based on the most recent Mortgage that was taken out on this home.
Original Mortgage
$79,500
Interest Rate
8.27%
Mortgage Type
New Conventional
Purchase Details
Closed on
Feb 2, 1994
Create a Home Valuation Report for This Property
The Home Valuation Report is an in-depth analysis detailing your home's value as well as a comparison with similar homes in the area
Home Values in the Area
Average Home Value in this Area
Purchase History
| Date | Buyer | Sale Price | Title Company |
|---|---|---|---|
| Cantrell Charles | -- | None Available | |
| Cantrell Charles | -- | None Available | |
| Federal Home Loan Mortgage Corporation | $43,334 | -- | |
| Denise G Ferber | $82,000 | -- | |
| -- | -- | -- |
Source: Public Records
Mortgage History
| Date | Status | Borrower | Loan Amount |
|---|---|---|---|
| Previous Owner | Cantrell Charles | $62,500 | |
| Previous Owner | Denise G Ferber | $79,500 |
Source: Public Records
Tax History Compared to Growth
Tax History
| Year | Tax Paid | Tax Assessment Tax Assessment Total Assessment is a certain percentage of the fair market value that is determined by local assessors to be the total taxable value of land and additions on the property. | Land | Improvement |
|---|---|---|---|---|
| 2024 | $2,207 | $42,600 | $7,690 | $34,910 |
| 2023 | $2,207 | $42,600 | $7,690 | $34,910 |
| 2022 | $2,211 | $42,600 | $7,690 | $34,910 |
| 2021 | $1,658 | $28,050 | $6,520 | $21,530 |
| 2020 | $1,662 | $28,050 | $6,520 | $21,530 |
| 2019 | $1,689 | $28,050 | $6,520 | $21,530 |
| 2018 | $1,493 | $22,950 | $2,900 | $20,050 |
| 2017 | $1,394 | $19,667 | $2,898 | $16,769 |
| 2016 | $1,386 | $19,667 | $2,898 | $16,769 |
| 2015 | $4,488 | $20,384 | $2,898 | $17,486 |
| 2014 | $1,424 | $20,384 | $2,898 | $17,486 |
| 2013 | $2,499 | $20,384 | $2,898 | $17,486 |
Source: Public Records
Map
Nearby Homes
- 110 E Lincoln St
- 312 Jefferson St
- 514 W Jefferson St
- 224 Orth Dr
- 225 Prentice Dr
- 212 Lightfoot Ct
- 214 Lightfoot Ct
- 202 Fenwick Dr
- 201 Lightfoot Ct
- 211 Lightfoot Ct
- 210 Zimmerman St
- 209 Lightfoot Ct
- 222 Rawson Dr
- 1207 N Scott St
- 1204 N Scott St
- 1211 N Scott St
- 315 Fenwick Dr
- 1101 Cambridge Ct Unit 1103
- 703 Brubaker Dr
- 705 Brubaker Dr
- 100 S Pike St
- 108 S Pike St
- 124 E Washington St
- 102 N Pike St
- 110 S Pike St
- 118 E Washington St
- 104 N Pike St
- 115 E Washington St
- 106 N Pike St
- 104 S Main St
- 100 S Main St
- 100 S Main St Unit 5
- 107 N Pike St
- 107 E Washington St Unit 109
- 209 E Jefferson St
- 200 S Pike St
- 202 E Jefferson St
- 108 N Pike St
- 106 N Main St
- 10523 Kend Road