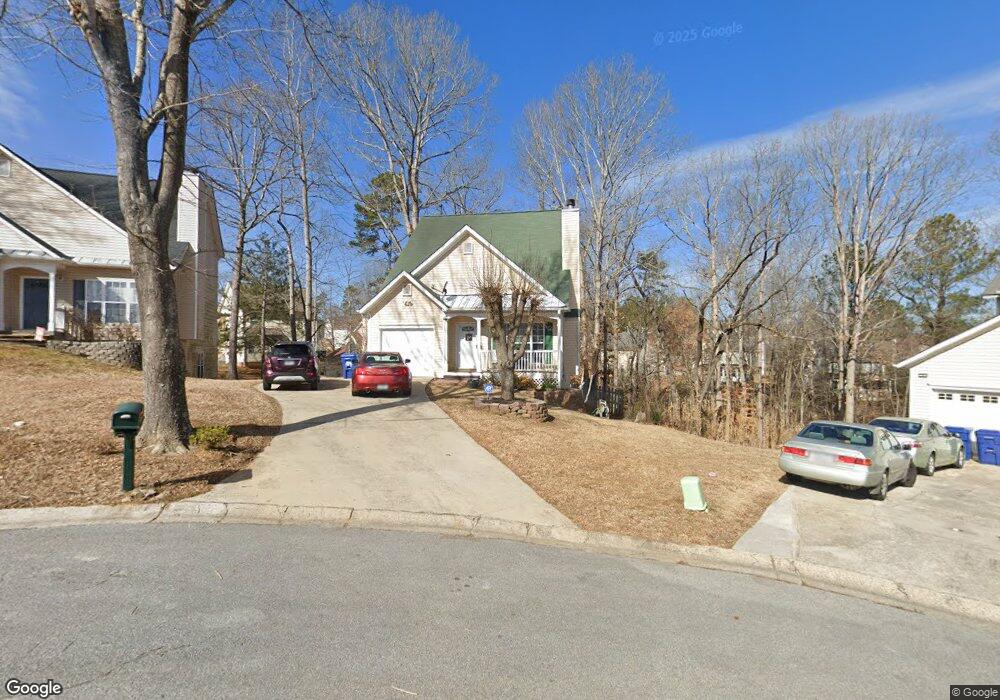
104 St Charles Ave Dallas, GA 30157
Estimated Value: $253,000 - $277,000
3
Beds
3
Baths
1,314
Sq Ft
$203/Sq Ft
Est. Value
About This Home
This home is located at 104 St Charles Ave, Dallas, GA 30157 and is currently estimated at $266,575, approximately $202 per square foot. 104 St Charles Ave is a home located in Paulding County with nearby schools including Allgood Elementary School, Herschel Jones Middle School, and Paulding County High School.
Ownership History
Date
Name
Owned For
Owner Type
Purchase Details
Closed on
Sep 15, 2006
Sold by
Denny Matthew
Bought by
Fisher Deborrah
Current Estimated Value
Home Financials for this Owner
Home Financials are based on the most recent Mortgage that was taken out on this home.
Original Mortgage
$26,500
Interest Rate
6.17%
Mortgage Type
Unknown
Purchase Details
Closed on
Aug 30, 2002
Sold by
Roberts Matthew S and Roberts Heather D
Bought by
Denny Matthew
Home Financials for this Owner
Home Financials are based on the most recent Mortgage that was taken out on this home.
Original Mortgage
$115,000
Interest Rate
6.21%
Mortgage Type
New Conventional
Purchase Details
Closed on
Jan 26, 1999
Sold by
Tanglwood Homes Inc
Bought by
Roberts Matthew S and Roberts Heathe
Home Financials for this Owner
Home Financials are based on the most recent Mortgage that was taken out on this home.
Original Mortgage
$90,800
Interest Rate
6.71%
Mortgage Type
New Conventional
Create a Home Valuation Report for This Property
The Home Valuation Report is an in-depth analysis detailing your home's value as well as a comparison with similar homes in the area
Home Values in the Area
Average Home Value in this Area
Purchase History
| Date | Buyer | Sale Price | Title Company |
|---|---|---|---|
| Fisher Deborrah | $132,500 | -- | |
| Denny Matthew | $115,000 | -- | |
| Roberts Matthew S | $93,700 | -- |
Source: Public Records
Mortgage History
| Date | Status | Borrower | Loan Amount |
|---|---|---|---|
| Closed | Fisher Deborrah | $26,500 | |
| Open | Fisher Deborrah | $106,000 | |
| Previous Owner | Denny Matthew | $115,000 | |
| Previous Owner | Roberts Matthew S | $90,800 |
Source: Public Records
Tax History Compared to Growth
Tax History
| Year | Tax Paid | Tax Assessment Tax Assessment Total Assessment is a certain percentage of the fair market value that is determined by local assessors to be the total taxable value of land and additions on the property. | Land | Improvement |
|---|---|---|---|---|
| 2024 | $1,187 | $92,280 | $12,000 | $80,280 |
| 2023 | $1,126 | $94,136 | $12,000 | $82,136 |
| 2022 | $649 | $81,964 | $12,000 | $69,964 |
| 2021 | $1,038 | $59,596 | $8,000 | $51,596 |
| 2020 | $1,137 | $52,036 | $8,000 | $44,036 |
| 2019 | $1,589 | $46,328 | $8,000 | $38,328 |
| 2018 | $1,237 | $41,060 | $8,000 | $33,060 |
| 2017 | $1,328 | $38,256 | $8,000 | $30,256 |
| 2016 | $1,277 | $37,120 | $8,000 | $29,120 |
| 2015 | $891 | $28,952 | $8,000 | $20,952 |
| 2014 | $827 | $26,208 | $8,000 | $18,208 |
| 2013 | -- | $19,480 | $8,000 | $11,480 |
Source: Public Records
Map
Nearby Homes
- 412 Oak View Ln
- 508 Oak View Ln
- 510 Oak View Ln
- 512 Oak View Ln
- 500 Oak View Ln
- Darwin Plan at Oakleigh Glen
- Penwell Plan at Oakleigh Glen
- Robie Plan at Oakleigh Glen
- at Oakleigh Glen
- Aria Plan at Oakleigh Glen
- Belhaven Plan at Oakleigh Glen
- 518 Oak View Ln
- 520 Oak View Ln
- 305 Oak View Ln
- 414 Oak View Ln
- 416 Oak View Ln
- 305 Remington Place Blvd
- 215 Toulouse St
- 217 Toulouse St
- 106 St Charles Ave
- 102 St Charles Ave
- 213 Toulouse St
- 219 Toulouse St
- 205 Toulouse St
- 100 Saint Charles Ave Unit 100
- 203 Toulouse St
- 100 St Charles Ave
- 211 Toulouse St
- 103 Saint Charles Ave Unit 103
- 216 Toulouse St
- 109 St Charles Ave
- 103 St Charles Ave Unit 103
- 103 St Charles Ave
- 107 St Charles Ave
- 105 St Charles Ave
- 214 Toulouse St
- 201 Toulouse St