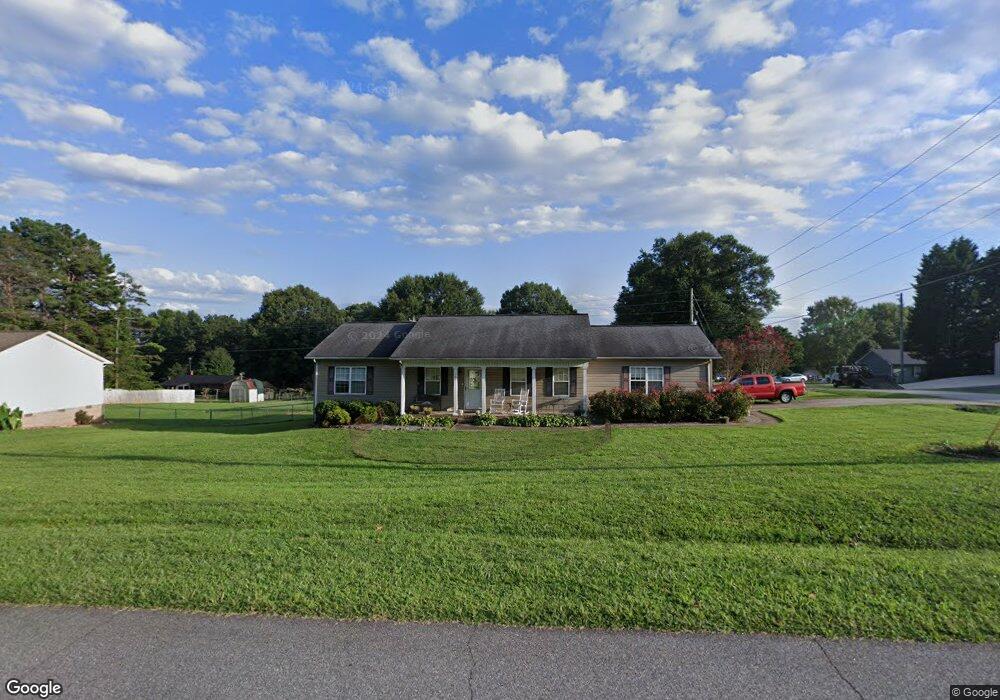
104 Starnes Ln Taylorsville, NC 28681
Estimated Value: $249,559 - $270,000
--
Bed
--
Bath
1,232
Sq Ft
$212/Sq Ft
Est. Value
About This Home
This home is located at 104 Starnes Ln, Taylorsville, NC 28681 and is currently estimated at $260,890, approximately $211 per square foot. 104 Starnes Ln is a home located in Alexander County with nearby schools including Bethlehem Elementary School, West Alexander Middle School, and Alexander Central High School.
Ownership History
Date
Name
Owned For
Owner Type
Purchase Details
Closed on
Nov 25, 2013
Sold by
Daniels William Gregory and Daniels Deborah Renee
Bought by
Daniels William Gregory and Daniels Deborah Renee
Current Estimated Value
Home Financials for this Owner
Home Financials are based on the most recent Mortgage that was taken out on this home.
Original Mortgage
$103,400
Outstanding Balance
$77,132
Interest Rate
4.16%
Mortgage Type
New Conventional
Estimated Equity
$183,758
Purchase Details
Closed on
Sep 16, 2008
Sold by
Mclaughlin Robert and Mclaughlin Hettie
Bought by
Daniels William Gregory and Daniels Deborah Renee
Purchase Details
Closed on
Dec 1, 2006
Sold by
Daniels Deborah Renee and Daniels William Gregory
Bought by
Daniels Deborah Renee and Hoyle Roberta Eunice
Purchase Details
Closed on
Feb 27, 2006
Sold by
Bolick Gary D and Moore Jennifer L
Bought by
Daniels Deborah and Hoyle Roberta
Create a Home Valuation Report for This Property
The Home Valuation Report is an in-depth analysis detailing your home's value as well as a comparison with similar homes in the area
Home Values in the Area
Average Home Value in this Area
Purchase History
| Date | Buyer | Sale Price | Title Company |
|---|---|---|---|
| Daniels William Gregory | -- | None Available | |
| Daniels William Gregory | -- | None Available | |
| Daniels Deborah Renee | -- | -- | |
| Daniels Deborah | $123,000 | -- |
Source: Public Records
Mortgage History
| Date | Status | Borrower | Loan Amount |
|---|---|---|---|
| Open | Daniels William Gregory | $103,400 |
Source: Public Records
Tax History Compared to Growth
Tax History
| Year | Tax Paid | Tax Assessment Tax Assessment Total Assessment is a certain percentage of the fair market value that is determined by local assessors to be the total taxable value of land and additions on the property. | Land | Improvement |
|---|---|---|---|---|
| 2025 | $1,351 | $190,321 | $22,550 | $167,771 |
| 2024 | $1,357 | $190,321 | $22,550 | $167,771 |
| 2023 | $1,585 | $190,321 | $22,550 | $167,771 |
| 2022 | $968 | $116,199 | $20,500 | $95,699 |
| 2021 | $968 | $116,199 | $20,500 | $95,699 |
| 2020 | $968 | $116,199 | $20,500 | $95,699 |
| 2019 | $968 | $116,199 | $20,500 | $95,699 |
| 2018 | $954 | $116,199 | $20,500 | $95,699 |
| 2017 | $954 | $116,199 | $20,500 | $95,699 |
| 2016 | $954 | $116,199 | $20,500 | $95,699 |
| 2015 | $954 | $116,199 | $20,500 | $95,699 |
| 2014 | $954 | $124,906 | $20,500 | $104,406 |
| 2012 | -- | $124,906 | $20,500 | $104,406 |
Source: Public Records
Map
Nearby Homes
- 111 Brookwood Ln
- 205 Bethlehem School Rd
- 127 Serenity Ln Unit 38/39
- 191 Arbor Springs Dr
- Lot 132 Rocky Acres Rd Unit 132
- 45 Bowman Hills Rd
- 100 Pinecrest Ct
- Lot 88 Kilmer Ct Unit 88
- 70 S Bethlehem Terrace Ln Unit 3
- 00 Cedar Woods Rd
- Lot 274 Whitman Ct Unit 274
- Lot 280 Whitman Ct Unit 280
- Lot 89 Browning Dr Unit 89
- 439 Kipling Dr
- 157 Blackberry Ln
- 248 Riley Dr Unit 248
- Lot 263 Riley Dr Unit 263
- 63 Frost Ln
- 162 Wortman Dr
- 266 Wittenburg Springs Dr
- 124 Starnes Ln
- 0 Brook Hollow Ln Unit 9594176
- 0 Brook Hollow Ln Unit CAR4017465
- 45 Brook Hollow Ln
- 74 Starnes Ln
- 123 Brook Hollow Ln
- 524 Teague Town Rd
- 12 Westbrook Dr
- 151 Brook Hollow Ln
- 176 Starnes Ln
- 28 Westbrook Dr
- 00 Brook Hollow Ln
- 000 Brook Hollow Ln
- 38 Starnes Ln
- 80 Brook Hollow Ln
- 183 Brook Hollow Ln
- 220 Starnes Ln
- 40 Westbrook Dr
- 465 Brook Hollow Ln
- 63 Westbrook Dr