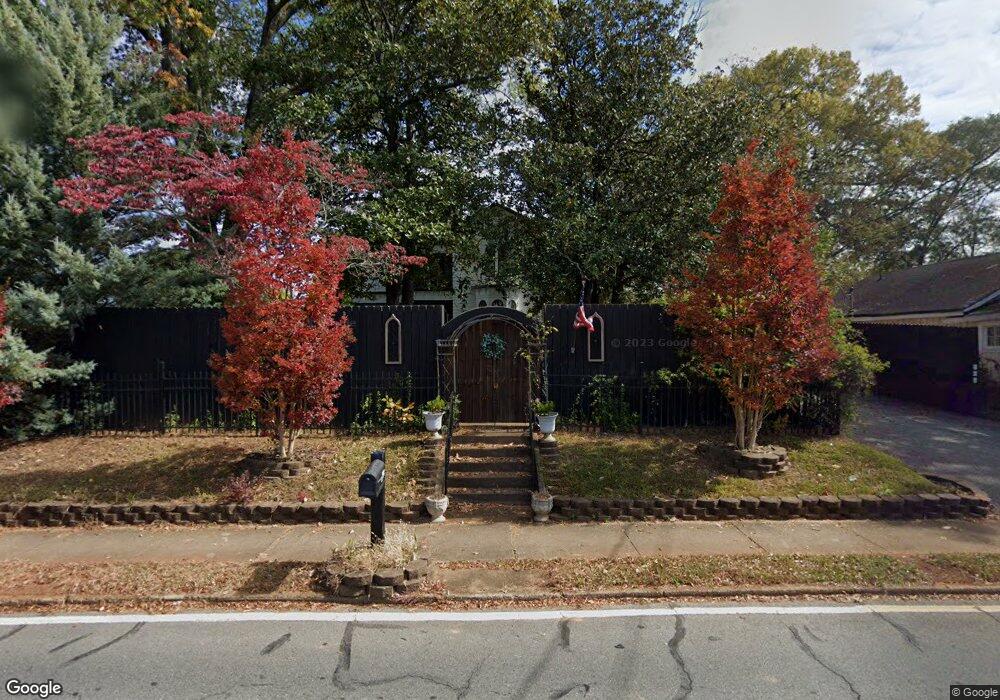
104 Stonewall St Cartersville, GA 30120
Estimated Value: $868,695
--
Bed
--
Bath
5,073
Sq Ft
$171/Sq Ft
Est. Value
About This Home
This home is located at 104 Stonewall St, Cartersville, GA 30120 and is currently estimated at $868,695, approximately $171 per square foot. 104 Stonewall St is a home located in Bartow County with nearby schools including Cartersville Primary School, Cartersville Elementary School, and Cartersville Middle School.
Ownership History
Date
Name
Owned For
Owner Type
Purchase Details
Closed on
Sep 24, 2015
Sold by
Benford Penni
Bought by
Penni Dru Investments Llc
Current Estimated Value
Purchase Details
Closed on
Apr 22, 2013
Sold by
Federal Deposit Insurance Corporation
Bought by
2012 1 Cre Adc Reo Ga Retail L
Purchase Details
Closed on
Dec 4, 2012
Sold by
Atkins Vickey Robinson
Bought by
Fdic
Purchase Details
Closed on
Jan 15, 2008
Sold by
Atkins Vickey R
Bought by
Flavorful Events Inc
Create a Home Valuation Report for This Property
The Home Valuation Report is an in-depth analysis detailing your home's value as well as a comparison with similar homes in the area
Home Values in the Area
Average Home Value in this Area
Purchase History
| Date | Buyer | Sale Price | Title Company |
|---|---|---|---|
| Penni Dru Investments Llc | -- | -- | |
| Benford Penni | $380,000 | -- | |
| 2012 1 Cre Adc Reo Ga Retail L | -- | -- | |
| Fdic | $325,550 | -- | |
| Flavorful Events Inc | $1,050,000 | -- |
Source: Public Records
Tax History Compared to Growth
Tax History
| Year | Tax Paid | Tax Assessment Tax Assessment Total Assessment is a certain percentage of the fair market value that is determined by local assessors to be the total taxable value of land and additions on the property. | Land | Improvement |
|---|---|---|---|---|
| 2024 | $8,485 | $338,511 | $60,000 | $278,511 |
| 2023 | $8,485 | $338,511 | $60,000 | $278,511 |
| 2022 | $5,476 | $207,184 | $50,000 | $157,184 |
| 2021 | $5,629 | $207,184 | $50,000 | $157,184 |
| 2020 | $5,846 | $207,184 | $50,000 | $157,184 |
| 2019 | $4,431 | $152,800 | $72,800 | $80,000 |
| 2018 | $4,462 | $152,800 | $72,800 | $80,000 |
| 2017 | $4,557 | $152,800 | $72,800 | $80,000 |
| 2016 | $4,607 | $152,000 | $72,000 | $80,000 |
| 2015 | $6,474 | $218,360 | $72,800 | $145,560 |
| 2014 | -- | $224,000 | $45,320 | $178,680 |
| 2013 | -- | $228,200 | $45,320 | $182,880 |
Source: Public Records
Map
Nearby Homes