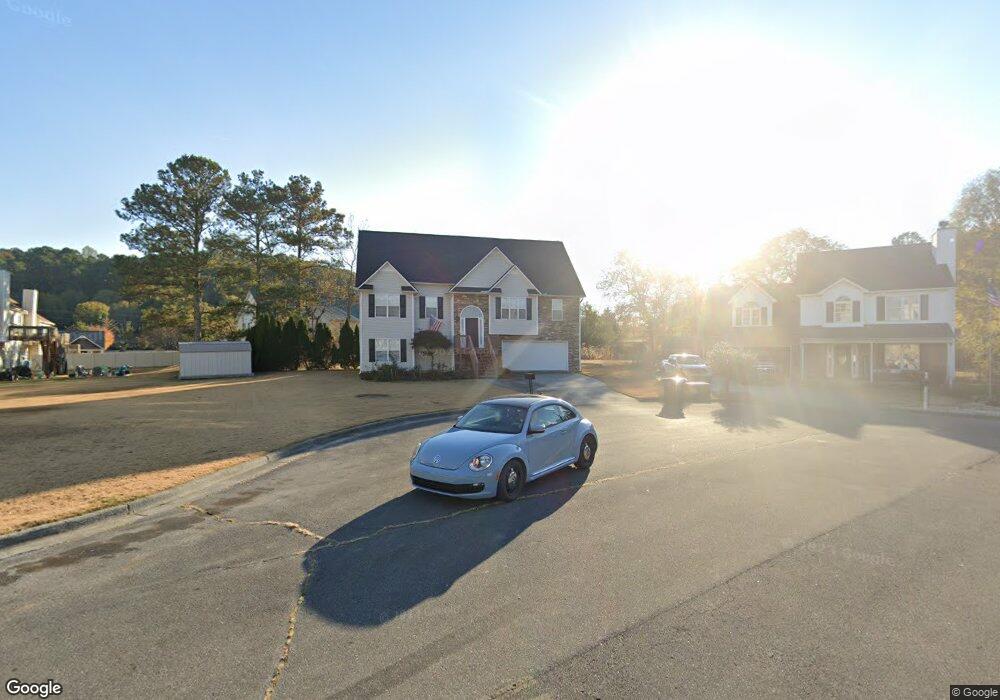
104 Summerfield Ct NE Calhoun, GA 30701
Estimated Value: $285,000 - $310,000
3
Beds
3
Baths
2,010
Sq Ft
$147/Sq Ft
Est. Value
About This Home
This home is located at 104 Summerfield Ct NE, Calhoun, GA 30701 and is currently estimated at $295,284, approximately $146 per square foot. 104 Summerfield Ct NE is a home located in Gordon County with nearby schools including Red Bud Elementary School.
Ownership History
Date
Name
Owned For
Owner Type
Purchase Details
Closed on
Feb 4, 2005
Sold by
Carter Phillip
Bought by
Flores Hector E
Current Estimated Value
Home Financials for this Owner
Home Financials are based on the most recent Mortgage that was taken out on this home.
Original Mortgage
$135,703
Outstanding Balance
$68,703
Interest Rate
5.69%
Mortgage Type
New Conventional
Estimated Equity
$226,581
Purchase Details
Closed on
Sep 30, 2002
Sold by
Frix Johnny D and Frix B
Bought by
Carter Phillip and Carter Jennifer
Purchase Details
Closed on
Sep 10, 2002
Sold by
Home Mart Builders Inc
Bought by
Frix Johnny D and Frix B
Purchase Details
Closed on
Sep 1, 2002
Sold by
Home Mart Builders Inc
Bought by
Home Mart Builders Inc
Purchase Details
Closed on
Apr 1, 2002
Sold by
Pfw Properties Inc
Bought by
Home Mart Builders Inc
Purchase Details
Closed on
May 11, 2001
Sold by
G Bonner Construction Co Inc
Bought by
Pfw Properties Inc
Purchase Details
Closed on
Apr 14, 2000
Sold by
Brent Stepp Cons'T Co Inc
Bought by
G Bonner Construction Co Inc
Create a Home Valuation Report for This Property
The Home Valuation Report is an in-depth analysis detailing your home's value as well as a comparison with similar homes in the area
Home Values in the Area
Average Home Value in this Area
Purchase History
| Date | Buyer | Sale Price | Title Company |
|---|---|---|---|
| Flores Hector E | $139,900 | -- | |
| Carter Phillip | $124,000 | -- | |
| Frix Johnny D | -- | -- | |
| Home Mart Builders Inc | -- | -- | |
| Home Mart Builders Inc | $16,500 | -- | |
| Pfw Properties Inc | -- | -- | |
| G Bonner Construction Co Inc | $210,200 | -- |
Source: Public Records
Mortgage History
| Date | Status | Borrower | Loan Amount |
|---|---|---|---|
| Open | Flores Hector E | $135,703 |
Source: Public Records
Tax History Compared to Growth
Tax History
| Year | Tax Paid | Tax Assessment Tax Assessment Total Assessment is a certain percentage of the fair market value that is determined by local assessors to be the total taxable value of land and additions on the property. | Land | Improvement |
|---|---|---|---|---|
| 2024 | $2,754 | $98,600 | $5,880 | $92,720 |
| 2023 | $2,575 | $92,240 | $5,880 | $86,360 |
| 2022 | $716 | $77,280 | $4,680 | $72,600 |
| 2021 | $1,859 | $63,080 | $4,680 | $58,400 |
| 2020 | $1,889 | $63,600 | $4,680 | $58,920 |
| 2019 | $1,886 | $63,600 | $4,680 | $58,920 |
| 2018 | $489 | $52,800 | $4,680 | $48,120 |
| 2017 | $473 | $50,160 | $4,680 | $45,480 |
| 2016 | $475 | $50,160 | $4,680 | $45,480 |
| 2015 | $471 | $49,240 | $4,680 | $44,560 |
| 2014 | $447 | $47,374 | $4,704 | $42,670 |
Source: Public Records
Map
Nearby Homes
- 129 Green Meadow Ln NE
- 126 Summerfield Ln NE
- 111 Sycamore Ln
- 113 Sycamore Ln
- 102 Sycamore Ln
- 114 Sycamore Ln
- 116 Sycamore Ln
- 118 Sycamore Ln
- The Crawford Plan at Sycamore Crest
- The Benson II Plan at Sycamore Crest
- The Norwood II Plan at Sterling at the Villages
- The Piedmont Plan at Sycamore Crest
- The Caldwell Plan at Sycamore Crest
- The McGinnis Plan at Sycamore Crest
- The Bradley Plan at Sycamore Crest
- The Harrington Plan at Sycamore Crest
- 225 Sycamore Dr
- 216 Sycamore Dr
- 106 Summerfield Ct NE
- 110 Summerfield Way NE
- 106 Summerfield Dr NE
- 108 Summerfield Way NE
- 108 Summerfield Ct NE
- 143 Green Meadow Ln NE
- 110 Summerfield Ct NE
- 106 Summerfield Way NE
- 117 Green Meadow Ln NE
- 110 Summerfield Dr NE
- 155 Green Meadow Ln NE
- 107 Summerfield Dr NE
- 105 Summerfield Dr NE
- 112 Summerfield Dr NE
- 104 Summerfield Way NE
- 109 Summerfield Dr NE
- 103 Summerfield Dr NE
- 104 Summerfield Ln NE
- 105 Green Meadow Ln NE
- 104 Summerfield Dr NE