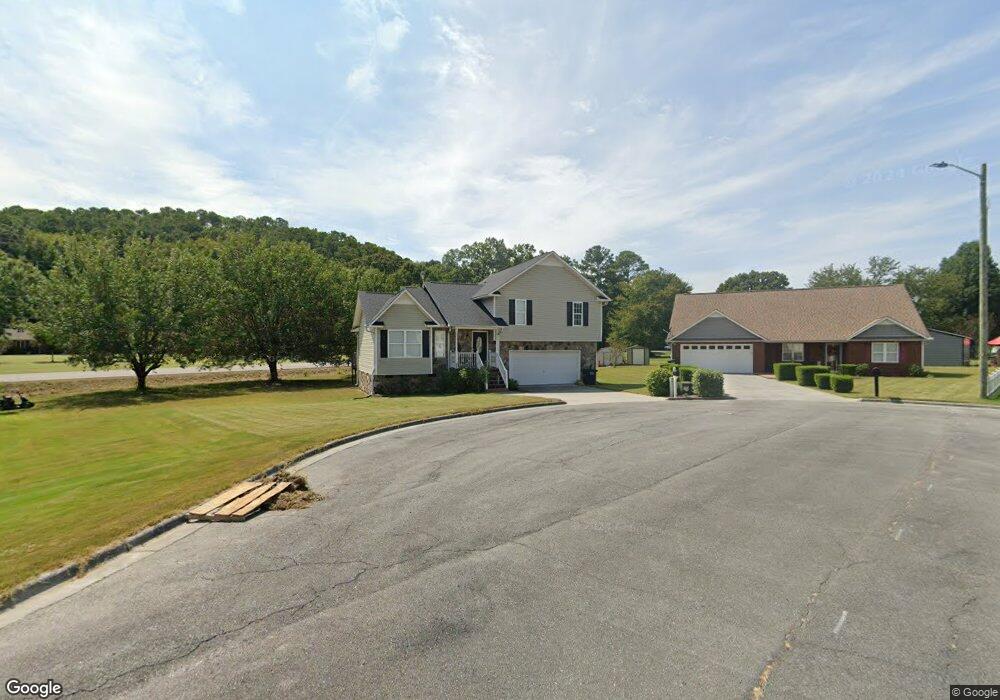
104 Summerfield Way NE Calhoun, GA 30701
Estimated Value: $263,656 - $300,000
3
Beds
3
Baths
1,957
Sq Ft
$143/Sq Ft
Est. Value
About This Home
This home is located at 104 Summerfield Way NE, Calhoun, GA 30701 and is currently estimated at $279,664, approximately $142 per square foot. 104 Summerfield Way NE is a home located in Gordon County with nearby schools including Belwood Elementary School.
Ownership History
Date
Name
Owned For
Owner Type
Purchase Details
Closed on
Dec 9, 2005
Sold by
Montenegro Edy Alberto
Bought by
Montenegro Edy Alberto and Montenegro Diana
Current Estimated Value
Purchase Details
Closed on
Jun 8, 2005
Sold by
Nilo Dorothy S
Bought by
Montenegro Edy Alberto
Home Financials for this Owner
Home Financials are based on the most recent Mortgage that was taken out on this home.
Original Mortgage
$80,000
Interest Rate
5.7%
Mortgage Type
New Conventional
Purchase Details
Closed on
May 3, 2002
Sold by
Home Mart Builders Inc
Bought by
Nilo Dorothy S
Purchase Details
Closed on
Feb 11, 2002
Sold by
Pfw Properties Inc
Bought by
Home Mart Builders Inc
Purchase Details
Closed on
May 11, 2001
Sold by
G Bonner Construction Co Inc
Bought by
Pfw Properties Inc
Purchase Details
Closed on
Jun 20, 2000
Sold by
Brent Stepp Cons'T Co and Brent Inc
Bought by
G Bonner Construction Co Inc
Create a Home Valuation Report for This Property
The Home Valuation Report is an in-depth analysis detailing your home's value as well as a comparison with similar homes in the area
Home Values in the Area
Average Home Value in this Area
Purchase History
| Date | Buyer | Sale Price | Title Company |
|---|---|---|---|
| Montenegro Edy Alberto | -- | -- | |
| Montenegro Edy Alberto | $119,000 | -- | |
| Nilo Dorothy S | $100,900 | -- | |
| Home Mart Builders Inc | -- | -- | |
| Pfw Properties Inc | $435,000 | -- | |
| G Bonner Construction Co Inc | $210,200 | -- |
Source: Public Records
Mortgage History
| Date | Status | Borrower | Loan Amount |
|---|---|---|---|
| Previous Owner | Montenegro Edy Alberto | $80,000 |
Source: Public Records
Tax History Compared to Growth
Tax History
| Year | Tax Paid | Tax Assessment Tax Assessment Total Assessment is a certain percentage of the fair market value that is determined by local assessors to be the total taxable value of land and additions on the property. | Land | Improvement |
|---|---|---|---|---|
| 2024 | $1,708 | $83,960 | $5,880 | $78,080 |
| 2023 | $1,541 | $78,040 | $5,880 | $72,160 |
| 2022 | $600 | $65,080 | $4,680 | $60,400 |
| 2021 | $821 | $51,800 | $4,680 | $47,120 |
| 2020 | $1,547 | $52,200 | $4,680 | $47,520 |
| 2019 | $1,545 | $52,200 | $4,680 | $47,520 |
| 2018 | $394 | $42,880 | $4,680 | $38,200 |
| 2017 | $377 | $40,400 | $4,680 | $35,720 |
| 2016 | $378 | $40,400 | $4,680 | $35,720 |
| 2015 | $375 | $39,600 | $4,680 | $34,920 |
| 2014 | $351 | $37,605 | $4,704 | $32,901 |
Source: Public Records
Map
Nearby Homes
- 129 Green Meadow Ln NE
- 126 Summerfield Ln NE
- 111 Sycamore Ln
- 113 Sycamore Ln
- 102 Sycamore Ln
- 114 Sycamore Ln
- 116 Sycamore Ln
- 118 Sycamore Ln
- 225 Sycamore Dr
- 216 Sycamore Dr
- The Crawford Plan at Sycamore Crest
- The Benson II Plan at Sycamore Crest
- The Norwood II Plan at Sterling at the Villages
- The Piedmont Plan at Sycamore Crest
- The Caldwell Plan at Sycamore Crest
- The McGinnis Plan at Sycamore Crest
- The Bradley Plan at Sycamore Crest
- 106 Summerfield Way NE
- 108 Summerfield Way NE
- 105 Green Meadow Ln NE
- 110 Summerfield Way NE
- 117 Green Meadow Ln NE
- 1641 Dews Pond Rd SE
- 101 Summerfield Dr NE
- 104 Summerfield Ct NE
- 103 Summerfield Dr NE
- 312 Sycamore Dr
- 1663 Dews Pond Rd SE
- 106 Summerfield Ct NE
- 105 Summerfield Dr NE
- 106 Green Meadow Ln NE
- 118 Green Meadow Ln NE
- 106 Summerfield Dr NE
- 143 Green Meadow Ln NE
- 107 Summerfield Dr NE
- 130 Green Meadow Ln NE
- 108 Summerfield Ct NE