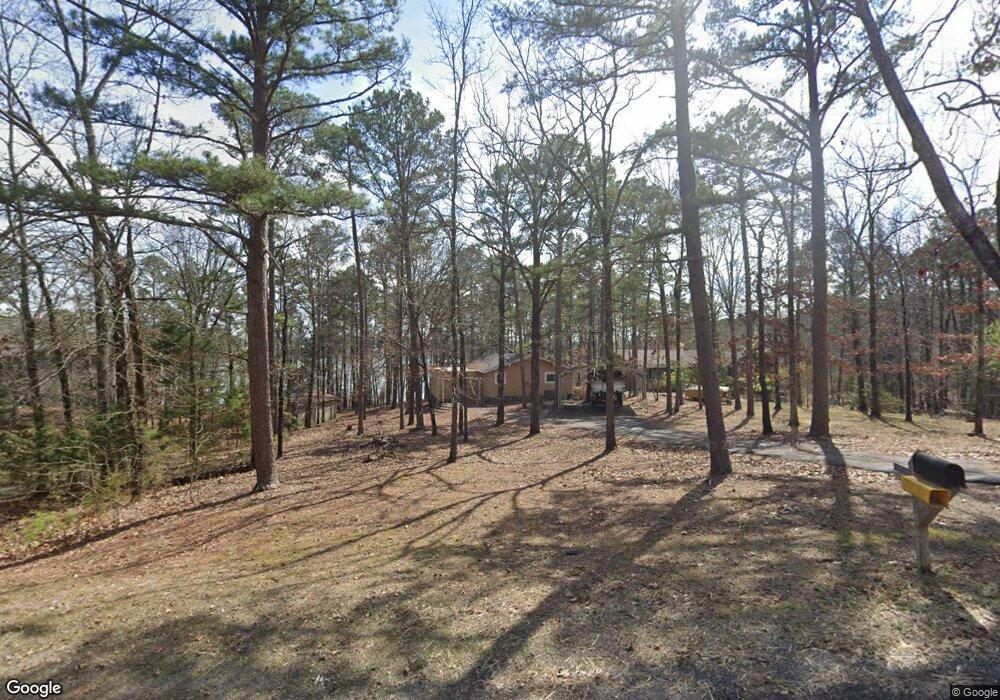
104 Valhalla Dr Edgemont, AR 72044
Estimated Value: $325,000 - $372,000
Studio
2
Baths
1,512
Sq Ft
$235/Sq Ft
Est. Value
About This Home
This home is located at 104 Valhalla Dr, Edgemont, AR 72044 and is currently estimated at $355,000, approximately $234 per square foot. 104 Valhalla Dr is a home located in Cleburne County with nearby schools including West Side Elementary School and West Side High School.
Ownership History
Date
Name
Owned For
Owner Type
Purchase Details
Closed on
Jun 29, 2021
Sold by
Jordan Thomas W
Bought by
Langrell Cecil and Langrell Carolyn
Current Estimated Value
Purchase Details
Closed on
Jan 30, 2018
Sold by
Nunez Javier
Bought by
Nunez Maria Licet
Purchase Details
Closed on
Jun 19, 2015
Sold by
Scattered Sunshine Llc
Bought by
Nunez Javier and Nunez Maria Lizet
Home Financials for this Owner
Home Financials are based on the most recent Mortgage that was taken out on this home.
Original Mortgage
$30,000
Interest Rate
3.9%
Mortgage Type
Purchase Money Mortgage
Purchase Details
Closed on
Oct 17, 2002
Bought by
Boling Mark D and Boling Julie N
Purchase Details
Closed on
Jul 10, 2001
Bought by
Nichols Edwin T and Nichols Janice L
Purchase Details
Closed on
Mar 8, 1993
Bought by
Abbett Thomas F and Abbett Wanda P
Create a Home Valuation Report for This Property
The Home Valuation Report is an in-depth analysis detailing your home's value as well as a comparison with similar homes in the area
Purchase History
| Date | Buyer | Sale Price | Title Company |
|---|---|---|---|
| Langrell Cecil | $36,000 | First National Title Company | |
| Nunez Maria Licet | -- | None Available | |
| Nunez Javier | $200,000 | Tainmy Bekhe Bacy Title Co | |
| Boling Mark D | $155,000 | -- | |
| Nichols Edwin T | $150,000 | -- | |
| Abbett Thomas F | $79,000 | -- |
Source: Public Records
Mortgage History
| Date | Status | Borrower | Loan Amount |
|---|---|---|---|
| Previous Owner | Nunez Javier | $30,000 |
Source: Public Records
Tax History
| Year | Tax Paid | Tax Assessment Tax Assessment Total Assessment is a certain percentage of the fair market value that is determined by local assessors to be the total taxable value of land and additions on the property. | Land | Improvement |
|---|---|---|---|---|
| 2025 | $1,934 | $60,091 | $16,000 | $44,091 |
| 2024 | $1,758 | $45,436 | $16,000 | $29,436 |
| 2023 | $1,723 | $45,436 | $16,000 | $29,436 |
| 2022 | $1,580 | $45,436 | $16,000 | $29,436 |
| 2021 | $1,436 | $37,108 | $15,000 | $22,108 |
| 2020 | $1,436 | $37,108 | $15,000 | $22,108 |
| 2019 | $1,436 | $37,108 | $15,000 | $22,108 |
| 2018 | $1,436 | $37,108 | $15,000 | $22,108 |
| 2017 | $1,377 | $37,108 | $15,000 | $22,108 |
| 2016 | $1,251 | $32,337 | $16,000 | $16,337 |
| 2015 | $1,251 | $32,337 | $16,000 | $16,337 |
| 2014 | $1,251 | $32,337 | $16,000 | $16,337 |
Source: Public Records
Map
Nearby Homes
- Lot B Traway Ln
- Lot D Traway Ln
- Lot 51 Valhalla Dr
- 85 Traway Ln
- 100 Traway Ln
- Lot C Stanfield Rd
- 624 Valhalla Dr
- 204 Genie Ln
- 474 Valhalla Dr
- 324 Valhalla Dr
- 349 the Bluffs Dr
- Lot 2 Bluff Dr
- Lot 3 Bluff Dr
- Lot 4 Bluff Dr
- Lot 6 & 7 Bluff Dr
- Lot 5 Bluff Dr
- LOT 6 Donham Dr
- 6 Holley Rd
- L10 Elrod Dr
- Lot 16 Bluff Dr
- 100 Valhalla Dr
- 124 Valhalla Dr
- 130 Valhalla Dr
- 134 Valhalla Dr
- 130 Vahalla Dr
- 57 Valhalla Dr
- Lot 39 Valhalla Dr
- 51 Valhalla Dr
- 47 Valhalla Dr
- 144 Valhalla Dr
- 36 Valhalla Dr
- 10 Traway Ln
- 00 Genie Lane - Lot 031 Replat
- 0 Lot A & B Stanfield Mystic Isle Rd Unit 22034032
- 0 Lot A & B Stanfield Mystic Isle Rd Unit 22009526
- 00 Stanfield Rd
- Lot B,C & D Traway Lane Stanfield Rd
- 0 Lot A B & C Mystic Isle Stanfield Rd Unit 24001252
- 0 Lot A B & C Mystic Isle Stanfield Rd Unit 23012141
- 164 Valhalla Dr
Your Personal Tour Guide
Ask me questions while you tour the home.