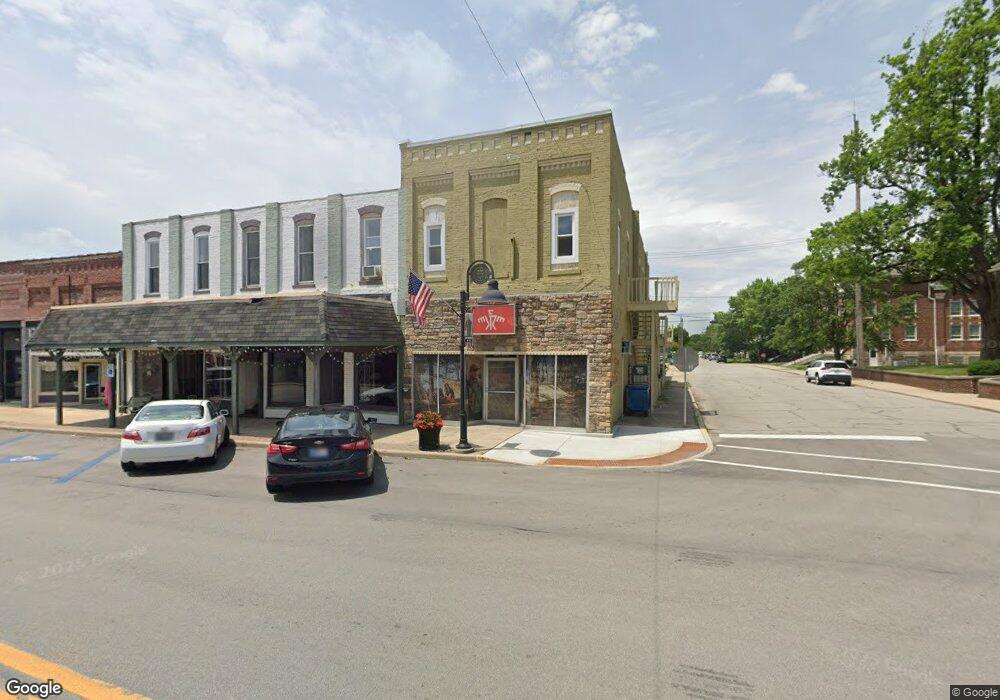
104 W 3rd St Sheridan, IN 46069
Estimated Value: $54,184
Studio
--
Bath
2,068
Sq Ft
$26/Sq Ft
Est. Value
About This Home
This home is located at 104 W 3rd St, Sheridan, IN 46069 and is currently estimated at $54,184, approximately $26 per square foot. 104 W 3rd St is a home located in Hamilton County with nearby schools including Sheridan Elementary School, Sheridan Middle School, and Sheridan High School.
Ownership History
Date
Name
Owned For
Owner Type
Purchase Details
Closed on
Mar 7, 2014
Sold by
Flint Jeffery A
Bought by
Kidpsych Inc
Current Estimated Value
Purchase Details
Closed on
Jul 18, 2011
Sold by
Iyer Properties Inc
Bought by
Flint Jeffery A
Purchase Details
Closed on
Dec 30, 2009
Sold by
Floyd Snodgrass Tina M
Bought by
M E R Properties Inc
Purchase Details
Closed on
May 14, 2001
Sold by
Mcmanis Craig L and Mcmanis Donna K
Bought by
Floyd Snodgrass Tina M
Home Financials for this Owner
Home Financials are based on the most recent Mortgage that was taken out on this home.
Original Mortgage
$38,500
Interest Rate
7.16%
Mortgage Type
Commercial
Create a Home Valuation Report for This Property
The Home Valuation Report is an in-depth analysis detailing your home's value as well as a comparison with similar homes in the area
Home Values in the Area
Average Home Value in this Area
Purchase History
| Date | Buyer | Sale Price | Title Company |
|---|---|---|---|
| Kidpsych Inc | -- | None Available | |
| Flint Jeffery A | -- | None Available | |
| M E R Properties Inc | -- | None Available | |
| Floyd Snodgrass Tina M | -- | -- |
Source: Public Records
Mortgage History
| Date | Status | Borrower | Loan Amount |
|---|---|---|---|
| Previous Owner | Floyd Snodgrass Tina M | $38,500 |
Source: Public Records
Tax History Compared to Growth
Tax History
| Year | Tax Paid | Tax Assessment Tax Assessment Total Assessment is a certain percentage of the fair market value that is determined by local assessors to be the total taxable value of land and additions on the property. | Land | Improvement |
|---|---|---|---|---|
| 2024 | $1,368 | $52,300 | $7,100 | $45,200 |
| 2023 | $1,393 | $48,400 | $5,900 | $42,500 |
| 2022 | $1,551 | $48,400 | $5,900 | $42,500 |
| 2021 | $1,557 | $46,900 | $5,900 | $41,000 |
| 2020 | $1,530 | $46,900 | $5,900 | $41,000 |
| 2019 | $1,639 | $48,200 | $5,900 | $42,300 |
| 2018 | $1,618 | $46,900 | $5,900 | $41,000 |
| 2017 | $1,574 | $45,900 | $5,900 | $40,000 |
| 2016 | $1,511 | $45,900 | $5,900 | $40,000 |
| 2014 | $1,544 | $48,400 | $10,500 | $37,900 |
| 2013 | $1,544 | $48,400 | $10,500 | $37,900 |
Source: Public Records
Map
Nearby Homes
- 400 S Georgia St
- 390 W State Road 38
- 100 S California St
- 903&905 S Georgia St
- 405 W 3rd St
- 600 S Georgia St
- 707 S Hamilton Ave
- 24145 Hinesley Rd
- 407 W 8th St
- 514 E 2nd St
- 24453 Kercheval St
- 700 W 2nd St
- 24498 Godby St
- Harmony Plan at Centre Place
- Stamford Plan at Centre Place
- Henley Plan at Centre Place
- Chatham Plan at Centre Place
- Holcombe Plan at Centre Place
- Aldridge Plan at Centre Place
- 3352 Godby Dr