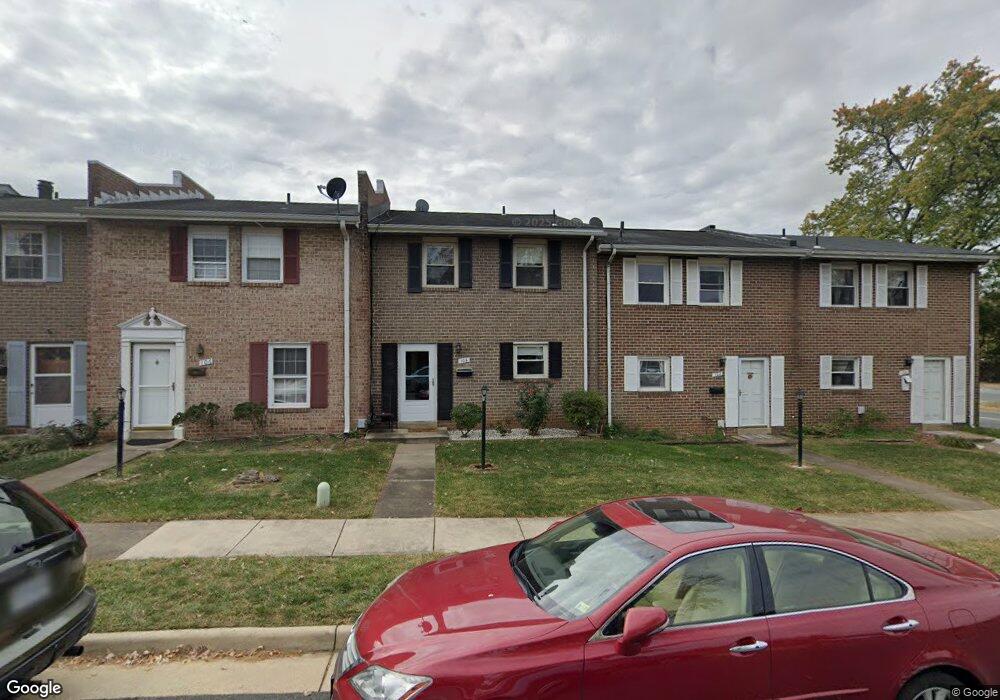
104 W Concord Ct Sterling, VA 20164
Estimated Value: $379,088 - $389,000
3
Beds
3
Baths
1,200
Sq Ft
$320/Sq Ft
Est. Value
About This Home
This home is located at 104 W Concord Ct, Sterling, VA 20164 and is currently estimated at $384,363, approximately $320 per square foot. 104 W Concord Ct is a home located in Loudoun County with nearby schools including Forest Grove Elementary School, Sterling Middle School, and Park View High School.
Ownership History
Date
Name
Owned For
Owner Type
Purchase Details
Closed on
Mar 8, 2024
Sold by
Lopez Jose Antonio and Vargas Aylen
Bought by
Martinez Argueta Jesus A and De Martinez L
Current Estimated Value
Home Financials for this Owner
Home Financials are based on the most recent Mortgage that was taken out on this home.
Original Mortgage
$87,500
Outstanding Balance
$86,047
Interest Rate
6.64%
Mortgage Type
New Conventional
Estimated Equity
$298,316
Purchase Details
Closed on
Feb 8, 2010
Sold by
Sanchez Eri C
Bought by
Lopez Jose Antonio
Home Financials for this Owner
Home Financials are based on the most recent Mortgage that was taken out on this home.
Original Mortgage
$119,230
Interest Rate
5.37%
Mortgage Type
FHA
Purchase Details
Closed on
Apr 27, 2007
Sold by
Caldwell Dora
Bought by
Sanchez Eric
Home Financials for this Owner
Home Financials are based on the most recent Mortgage that was taken out on this home.
Original Mortgage
$284,000
Interest Rate
6.18%
Mortgage Type
New Conventional
Create a Home Valuation Report for This Property
The Home Valuation Report is an in-depth analysis detailing your home's value as well as a comparison with similar homes in the area
Home Values in the Area
Average Home Value in this Area
Purchase History
| Date | Buyer | Sale Price | Title Company |
|---|---|---|---|
| Martinez Argueta Jesus A | -- | Versatile Title | |
| Lopez Jose Antonio | $126,000 | -- | |
| Sanchez Eric | $284,000 | -- |
Source: Public Records
Mortgage History
| Date | Status | Borrower | Loan Amount |
|---|---|---|---|
| Open | Martinez Argueta Jesus A | $87,500 | |
| Previous Owner | Lopez Jose Antonio | $119,230 | |
| Previous Owner | Sanchez Eric | $284,000 |
Source: Public Records
Tax History Compared to Growth
Tax History
| Year | Tax Paid | Tax Assessment Tax Assessment Total Assessment is a certain percentage of the fair market value that is determined by local assessors to be the total taxable value of land and additions on the property. | Land | Improvement |
|---|---|---|---|---|
| 2025 | $3,053 | $379,260 | $125,000 | $254,260 |
| 2024 | $3,036 | $351,020 | $125,000 | $226,020 |
| 2023 | $3,018 | $344,970 | $125,000 | $219,970 |
| 2022 | $2,889 | $324,590 | $120,000 | $204,590 |
| 2021 | $2,862 | $292,070 | $115,000 | $177,070 |
| 2020 | $2,790 | $269,610 | $100,000 | $169,610 |
| 2019 | $2,724 | $260,660 | $90,000 | $170,660 |
| 2018 | $2,729 | $251,510 | $90,000 | $161,510 |
| 2017 | $2,662 | $236,650 | $90,000 | $146,650 |
| 2016 | $2,557 | $223,320 | $0 | $0 |
| 2015 | $2,166 | $100,820 | $0 | $100,820 |
| 2014 | $2,063 | $93,600 | $0 | $93,600 |
Source: Public Records
Map
Nearby Homes
- 100 W Poplar Rd
- 801 S Concord Ct
- 1050 Ramsgate Ct Unit C
- 400 E Poplar Rd
- 314 E Staunton Ave
- 309 Williamsburg Rd
- 1002 S Buckingham Rd
- 1072 Norwood Ct
- 920 Windsor Ct
- 706 S Dogwood Ct
- 1030 Salisbury Ct
- 1034 Salisbury Ct
- 1049A Margate Ct
- 1048A Brixton Ct
- 1048A Margate Ct
- 1044 Brixton Ct Unit B
- 1006 S Greenthorn Ave
- 1114 S Dickenson Ave
- 801 S Filbert Ct
- 1028A Brixton Ct
- 106 W Concord Ct
- 102 W Concord Ct
- 108 W Concord Ct
- 100 W Concord Ct
- 110 W Concord Ct
- 112 W Concord Ct
- 820 N Concord Ct
- 818 N Concord Ct
- 113 W Concord Ct
- 816 N Concord Ct
- 115 W Concord Ct
- 900 S Sterling Blvd
- 814 N Concord Ct
- 117 W Concord Ct
- 124 W Concord Ct
- 119 W Concord Ct
- 812 N Concord Ct
- 126 W Concord Ct
- 121 W Concord Ct
- 100 E Poplar Rd