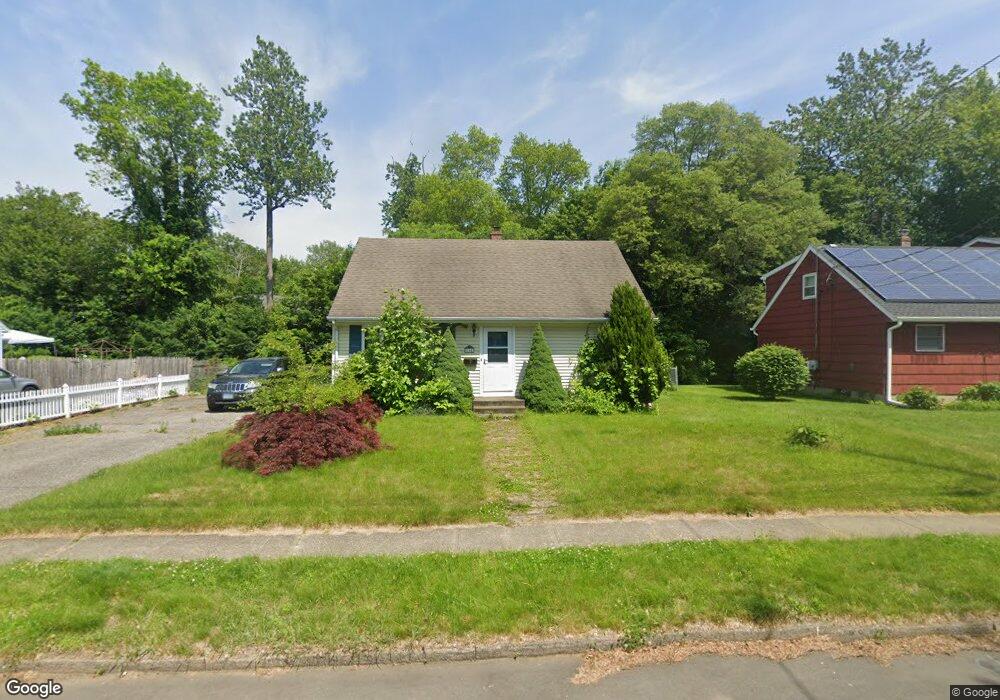
104 Wepawaug Dr Milford, CT 06461
Parkway/Wheelers Farm Road NeighborhoodEstimated Value: $450,715 - $543,000
4
Beds
2
Baths
1,465
Sq Ft
$342/Sq Ft
Est. Value
About This Home
This home is located at 104 Wepawaug Dr, Milford, CT 06461 and is currently estimated at $501,179, approximately $342 per square foot. 104 Wepawaug Dr is a home located in New Haven County with nearby schools including Mathewson School, Harborside Middle School, and Jonathan Law High School.
Ownership History
Date
Name
Owned For
Owner Type
Purchase Details
Closed on
May 17, 2010
Sold by
Rubin Lee Eric and Rubin Jamie Allyn
Bought by
Connelly Brian P
Current Estimated Value
Home Financials for this Owner
Home Financials are based on the most recent Mortgage that was taken out on this home.
Original Mortgage
$234,400
Outstanding Balance
$157,570
Interest Rate
5.11%
Estimated Equity
$343,609
Purchase Details
Closed on
Aug 30, 2006
Sold by
Hawes William J and Hawes Christine
Bought by
Rubin Lee Eric and Rubin Jamie Allyn
Purchase Details
Closed on
Oct 27, 2003
Sold by
Rasman Daniele L
Bought by
Hawes William J
Purchase Details
Closed on
Jan 5, 1990
Sold by
Griffin Dale A
Bought by
Raseman Kim H
Purchase Details
Closed on
Jul 22, 1988
Sold by
Tierney Norman S
Bought by
Griffin Dale A
Create a Home Valuation Report for This Property
The Home Valuation Report is an in-depth analysis detailing your home's value as well as a comparison with similar homes in the area
Home Values in the Area
Average Home Value in this Area
Purchase History
| Date | Buyer | Sale Price | Title Company |
|---|---|---|---|
| Connelly Brian P | $293,000 | -- | |
| Connelly Brian P | $293,000 | -- | |
| Rubin Lee Eric | $333,000 | -- | |
| Rubin Lee Eric | $333,000 | -- | |
| Hawes William J | $245,000 | -- | |
| Hawes William J | $245,000 | -- | |
| Raseman Kim H | $150,000 | -- | |
| Griffin Dale A | $163,000 | -- |
Source: Public Records
Mortgage History
| Date | Status | Borrower | Loan Amount |
|---|---|---|---|
| Open | Griffin Dale A | $234,400 | |
| Closed | Griffin Dale A | $234,400 |
Source: Public Records
Tax History Compared to Growth
Tax History
| Year | Tax Paid | Tax Assessment Tax Assessment Total Assessment is a certain percentage of the fair market value that is determined by local assessors to be the total taxable value of land and additions on the property. | Land | Improvement |
|---|---|---|---|---|
| 2025 | $6,052 | $204,790 | $94,250 | $110,540 |
| 2024 | $5,968 | $204,790 | $94,250 | $110,540 |
| 2023 | $5,564 | $204,790 | $94,250 | $110,540 |
| 2022 | $5,458 | $204,790 | $94,250 | $110,540 |
| 2021 | $4,910 | $177,580 | $69,300 | $108,280 |
| 2020 | $4,915 | $177,580 | $69,300 | $108,280 |
| 2019 | $4,921 | $177,580 | $69,300 | $108,280 |
| 2018 | $4,926 | $177,580 | $69,300 | $108,280 |
| 2017 | $4,935 | $177,580 | $69,300 | $108,280 |
| 2016 | $4,458 | $160,120 | $55,440 | $104,680 |
| 2015 | $4,464 | $160,120 | $55,440 | $104,680 |
| 2014 | $4,358 | $160,120 | $55,440 | $104,680 |
Source: Public Records
Map
Nearby Homes
- 492 North St
- 0 North St
- 180 Platt Ln
- 271 W River St
- 156 Meadow St
- 193 Wheelers Farms Rd
- 150 Forest Rd Unit 6
- 91 Forest Rd Unit B
- 25 Southwick Ct N
- 25 Forest Rd Unit D
- 97 North St
- 0 E Rutland Rd
- 36 Oronoque Rd
- 30 Corona Dr
- 32 Cedarhurst Ln
- 558 Treat Ln
- 252 Oronoque Rd
- 190 W Main St
- 238 Zion Hill Rd
- 82 Oak Ridge Ln