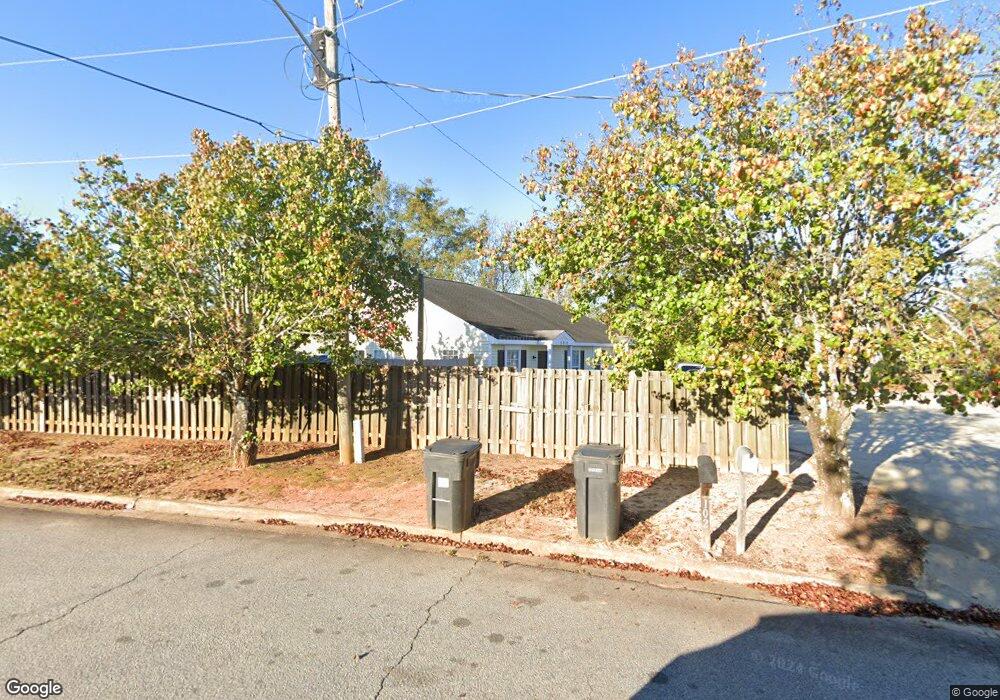
104 Westgate Ct Hephzibah, GA 30815
Jamestown NeighborhoodEstimated Value: $121,000 - $188,000
2
Beds
2
Baths
1,092
Sq Ft
$134/Sq Ft
Est. Value
About This Home
This home is located at 104 Westgate Ct, Hephzibah, GA 30815 and is currently estimated at $146,385, approximately $134 per square foot. 104 Westgate Ct is a home located in Richmond County with nearby schools including R.B. Hunt Elementary School, Deer Chase Elementary School, and Hephzibah Middle School.
Ownership History
Date
Name
Owned For
Owner Type
Purchase Details
Closed on
Jul 30, 2025
Sold by
Brame Bettie Mae
Bought by
Brahme Kwame and Brame Maurice
Current Estimated Value
Purchase Details
Closed on
May 5, 2015
Sold by
Brame Bettie Mae
Bought by
Bates Carolyn Jonie
Purchase Details
Closed on
Jan 29, 1999
Sold by
Brame Bettie M
Bought by
Brame Bettie M and Brame Mary
Home Financials for this Owner
Home Financials are based on the most recent Mortgage that was taken out on this home.
Original Mortgage
$1,077
Interest Rate
6.8%
Purchase Details
Closed on
Dec 21, 1998
Sold by
South Park Commons Llc
Bought by
Brame Bettie M
Home Financials for this Owner
Home Financials are based on the most recent Mortgage that was taken out on this home.
Original Mortgage
$1,077
Interest Rate
6.8%
Create a Home Valuation Report for This Property
The Home Valuation Report is an in-depth analysis detailing your home's value as well as a comparison with similar homes in the area
Home Values in the Area
Average Home Value in this Area
Purchase History
| Date | Buyer | Sale Price | Title Company |
|---|---|---|---|
| Brahme Kwame | -- | -- | |
| Brame Bettie Mae | -- | -- | |
| Bates Carolyn Jonie | -- | -- | |
| Bates Carolyn Jonie | -- | -- | |
| Brame Bettie M | -- | -- | |
| Brame Bettie M | $53,100 | -- |
Source: Public Records
Mortgage History
| Date | Status | Borrower | Loan Amount |
|---|---|---|---|
| Previous Owner | Brame Bettie M | $1,077 | |
| Previous Owner | Brame Bettie M | $52,091 |
Source: Public Records
Tax History Compared to Growth
Tax History
| Year | Tax Paid | Tax Assessment Tax Assessment Total Assessment is a certain percentage of the fair market value that is determined by local assessors to be the total taxable value of land and additions on the property. | Land | Improvement |
|---|---|---|---|---|
| 2025 | $1,939 | $54,660 | $5,600 | $49,060 |
| 2024 | $1,939 | $52,264 | $5,600 | $46,664 |
| 2023 | $1,802 | $41,944 | $5,600 | $36,344 |
| 2022 | $1,331 | $33,411 | $5,600 | $27,811 |
| 2021 | $1,234 | $27,292 | $5,600 | $21,692 |
| 2020 | $1,218 | $27,292 | $5,600 | $21,692 |
| 2019 | $1,279 | $27,292 | $5,600 | $21,692 |
| 2018 | $1,286 | $27,292 | $5,600 | $21,692 |
| 2017 | $1,215 | $27,292 | $5,600 | $21,692 |
| 2016 | $1,215 | $27,292 | $5,600 | $21,692 |
| 2015 | $1,222 | $27,292 | $5,600 | $21,692 |
Source: Public Records
Map
Nearby Homes
- 407 Woodhazel Way
- 2712 Fair Oak Ct
- 3743 Crest Dr
- 3747 Crest Dr
- 3753 Woodcock Dr
- 3510 Barker Dr
- 2859 Pepperdine Dr
- 4386 Creekview Dr
- 3332 Saddle Brook Dr
- 3821 Crest Dr
- 2813 Ridgecrest Dr
- 3621 Pebble Creek Dr
- 3623 Pebble Creek Dr
- 3629 Pebble Creek Dr
- 3627 Pebble Creek Dr
- 3625 Pebble Creek Dr
- 3603 Pebble Creek Dr
- 3409 Saddle Horn Run
- 3602 Pebble Creek Dr
- 4004 Rambling Way
- 3707 S Park Dr
- 102 Westgate Ct
- 305 Clearview Ct
- 307 Clearview Ct
- 303 Clearview Ct
- 101 Westgate Ct
- 103 Westgate Ct
- 105 Westgate Ct
- 107 Westgate Ct
- 201 Long Meadow Ln Unit 1
- 203 Long Meadow Ln
- 304 Clearview Ct
- 306 Clearview Ct
- 308 Clearview Ct
- 310 Clearview Ct
- 205 Long Meadow Ln
- 207 Long Meadow Ln
- 401 Woodhazel Way
- 209 Long Meadow Ln
- 210 Long Meadow Ln