Estimated Value: $347,715 - $396,000
--
Bed
--
Bath
2,980
Sq Ft
$123/Sq Ft
Est. Value
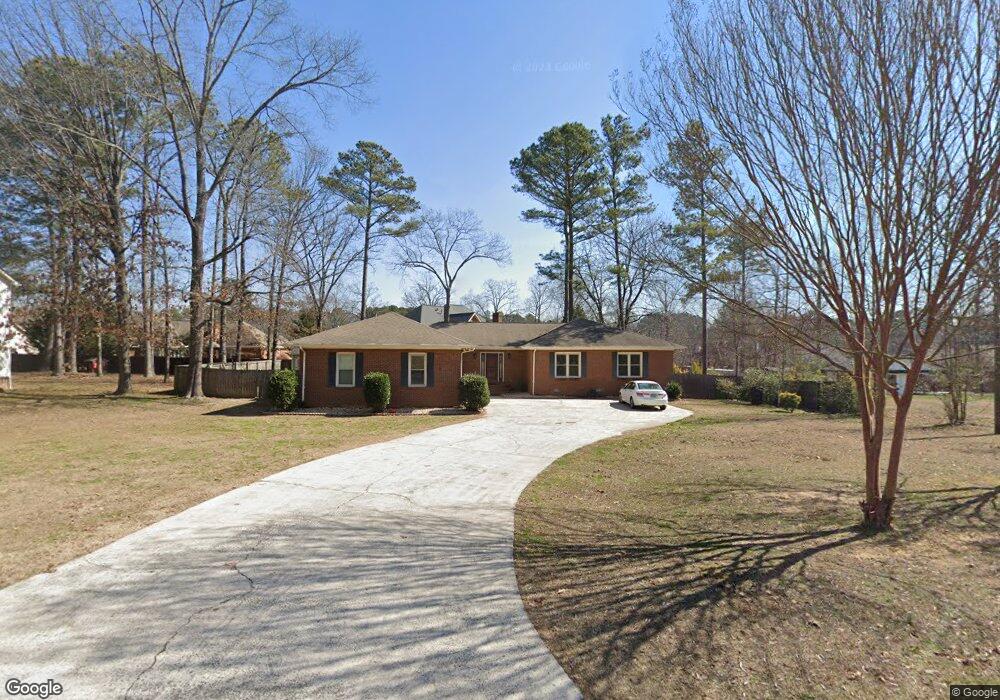
About This Home
This home is located at 104 Windwood Way NW, Rome, GA 30165 and is currently estimated at $366,429, approximately $122 per square foot. 104 Windwood Way NW is a home located in Floyd County with nearby schools including Rome High School.
Ownership History
Date
Name
Owned For
Owner Type
Purchase Details
Closed on
Aug 6, 2002
Sold by
Forbes Ryan K and Forbes Cynthia C
Bought by
Beasley David L and Beasley Cynthia D
Current Estimated Value
Purchase Details
Closed on
May 1, 1998
Sold by
Laidlaw Laidlaw C and Laidlaw Marjorie G
Bought by
Forbes Ryan K and Forbes Cynthia C
Purchase Details
Closed on
Nov 17, 1993
Sold by
Monroe Joseph C and Monroe Denise M
Bought by
Laidl Laidlaw C and Laidl Marjorie G
Purchase Details
Closed on
Jun 8, 1988
Sold by
Garden Lakes Company Inc The
Bought by
Monroe Joseph C and Monroe Denise M
Purchase Details
Closed on
Oct 30, 1978
Bought by
P and R
Purchase Details
Closed on
Jul 25, 1978
Sold by
Garden Lakes Development Co & Ruth E Har
Bought by
Garden Lakes Company Inc The
Purchase Details
Closed on
Jan 2, 1952
Bought by
P and R
Purchase Details
Closed on
Jan 1, 1952
Bought by
Garden Lakes Development Co & Ruth E Har
Create a Home Valuation Report for This Property
The Home Valuation Report is an in-depth analysis detailing your home's value as well as a comparison with similar homes in the area
Home Values in the Area
Average Home Value in this Area
Purchase History
| Date | Buyer | Sale Price | Title Company |
|---|---|---|---|
| Beasley David L | $147,000 | -- | |
| Forbes Ryan K | $133,400 | -- | |
| Laidl Laidlaw C | $105,000 | -- | |
| Monroe Joseph C | $105,500 | -- | |
| P | -- | -- | |
| Garden Lakes Company Inc The | -- | -- | |
| P | -- | -- | |
| Garden Lakes Development Co & Ruth E Har | -- | -- |
Source: Public Records
Tax History Compared to Growth
Tax History
| Year | Tax Paid | Tax Assessment Tax Assessment Total Assessment is a certain percentage of the fair market value that is determined by local assessors to be the total taxable value of land and additions on the property. | Land | Improvement |
|---|---|---|---|---|
| 2024 | $3,896 | $152,524 | $18,180 | $134,344 |
| 2023 | $3,871 | $136,818 | $16,160 | $120,658 |
| 2022 | $3,324 | $114,069 | $13,130 | $100,939 |
| 2021 | $3,107 | $99,041 | $13,130 | $85,911 |
| 2020 | $3,007 | $92,082 | $10,100 | $81,982 |
| 2019 | $2,908 | $87,970 | $10,100 | $77,870 |
| 2018 | $2,835 | $83,741 | $10,100 | $73,641 |
| 2017 | $2,763 | $79,602 | $10,100 | $69,502 |
| 2016 | $2,751 | $78,473 | $10,080 | $68,393 |
| 2015 | $2,606 | $78,473 | $10,080 | $68,393 |
| 2014 | $2,606 | $78,473 | $10,080 | $68,393 |
Source: Public Records
Map
Nearby Homes
- 224 Rolling Oaks Dr NW
- 8 Tall Pines Terrace NW
- 212 Rolling Oaks Dr NW
- 106 Eden Dr NW
- 16 Drexel Dr NW
- 7 Eden Dr NW
- 201 Rollingwood Cir NW
- 8 Cameo Dr NW
- 124 Beech Creek Dr NW
- 3605 Garden Lakes Pkwy
- 104 Beech Creek Dr NW
- 102 Beech Creek Dr NW
- 48 Fox Croft Rd NW
- 2890 Alabama Hwy NW
- 31 Williamsburg Dr NW
- 32 Donley Dr NW
- 106 Windwood Way NW
- 216 Rolling Pines Rd NW
- 100 Windwood Way NW
- 214 Rolling Pines Rd NW Unit 21
- 214 Rolling Pines Rd NW
- 103 Windwood Way NW
- 105 Windwood Way NW
- 108 Windwood Way NW
- 3604 Garden Lakes Pkwy NW
- 107 Windwood Way NW
- 219 Rolling Pines Rd NW
- 212 Rolling Pines Rd NW
- 99 Windwood Way NW
- 99 Windwood Way NW
- 3602 Garden Lakes Pkwy NW
- 104 Treeside Dr NW
- 217 Rolling Pines Rd NW
- 110 Windwood Way NW
- 102 Treeside Dr NW
- 106 Treeside Dr NW