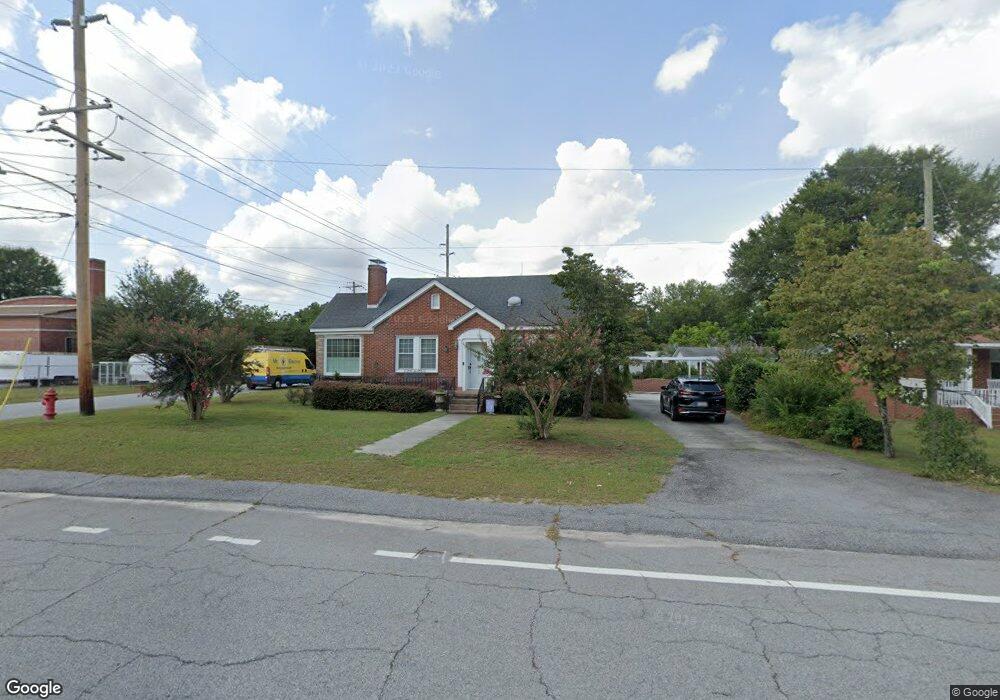
1040 B Ave West Columbia, SC 29169
Estimated Value: $268,187 - $334,000
4
Beds
3
Baths
1,616
Sq Ft
$183/Sq Ft
Est. Value
About This Home
This home is located at 1040 B Ave, West Columbia, SC 29169 and is currently estimated at $296,297, approximately $183 per square foot. 1040 B Ave is a home located in Lexington County with nearby schools including Cayce Elementary, Cyril B. Busbee Creative Arts Academy, and Brookland-Cayce High School.
Ownership History
Date
Name
Owned For
Owner Type
Purchase Details
Closed on
Dec 8, 2016
Sold by
Addy James W and Addy Lucile M
Bought by
Hyde Susan S
Current Estimated Value
Home Financials for this Owner
Home Financials are based on the most recent Mortgage that was taken out on this home.
Original Mortgage
$175,000
Outstanding Balance
$141,091
Interest Rate
3.47%
Mortgage Type
New Conventional
Estimated Equity
$155,206
Purchase Details
Closed on
Dec 22, 2004
Sold by
Psmc Properties Llc
Bought by
Addy James W and Addy Lucile M
Purchase Details
Closed on
Oct 6, 2004
Sold by
Branham Charlie
Bought by
Psmc Properties Llc
Create a Home Valuation Report for This Property
The Home Valuation Report is an in-depth analysis detailing your home's value as well as a comparison with similar homes in the area
Home Values in the Area
Average Home Value in this Area
Purchase History
| Date | Buyer | Sale Price | Title Company |
|---|---|---|---|
| Hyde Susan S | $175,000 | None Available | |
| Addy James W | $154,900 | -- | |
| Psmc Properties Llc | -- | -- |
Source: Public Records
Mortgage History
| Date | Status | Borrower | Loan Amount |
|---|---|---|---|
| Open | Hyde Susan S | $175,000 |
Source: Public Records
Tax History Compared to Growth
Tax History
| Year | Tax Paid | Tax Assessment Tax Assessment Total Assessment is a certain percentage of the fair market value that is determined by local assessors to be the total taxable value of land and additions on the property. | Land | Improvement |
|---|---|---|---|---|
| 2024 | $1,391 | $7,097 | $1,520 | $5,577 |
| 2023 | $1,357 | $7,097 | $1,520 | $5,577 |
| 2022 | $1,370 | $7,097 | $1,520 | $5,577 |
| 2020 | $1,316 | $7,097 | $1,520 | $5,577 |
| 2019 | $1,323 | $7,000 | $1,400 | $5,600 |
| 2018 | $1,337 | $7,000 | $1,400 | $5,600 |
| 2017 | $1,283 | $7,000 | $1,400 | $5,600 |
| 2016 | $490 | $5,163 | $1,400 | $3,763 |
| 2015 | $296 | $5,163 | $1,400 | $3,763 |
| 2014 | $296 | $4,751 | $1,260 | $3,491 |
| 2013 | -- | $4,750 | $1,260 | $3,490 |
Source: Public Records
Map
Nearby Homes