1040 Bluefield Dr Florissant, MO 63033
Estimated payment $3,057/month
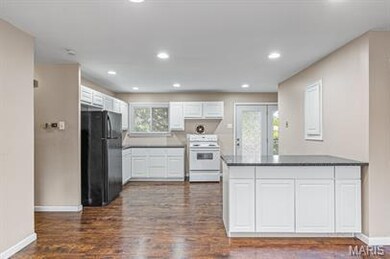
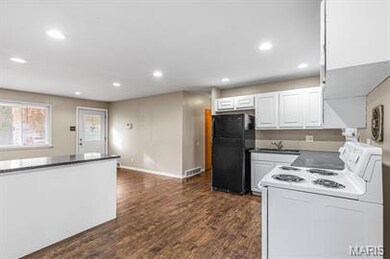
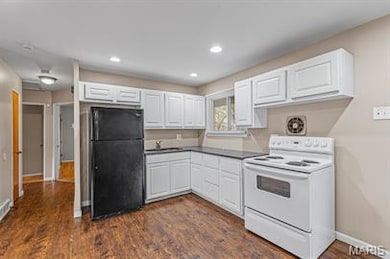
About This Home
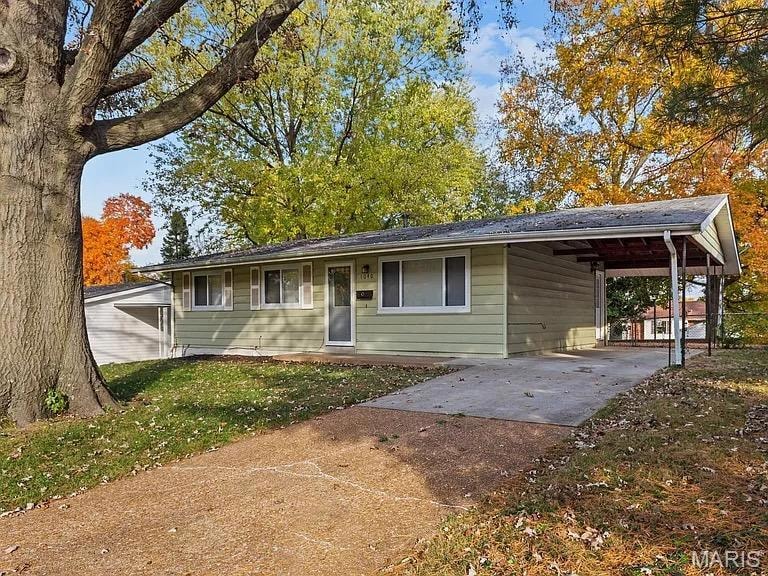
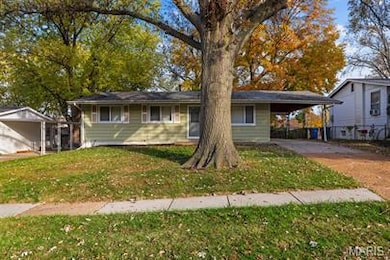
Investor Special – 4-Home Income-Producing Portfolio in Florissant! Solid opportunity to acquire a fully occupied package of 4 single-family homes in desirable Florissant neighborhoods. This turnkey investment brings in a total annual income of $61,976.61 (2024) with a net operating income (NOI) of $43,965.10—offering strong cash flow from day one. New Rent is now $5,838 to make 2025 Income $70,056 Included Properties (Sold as Package Only): 175 Clark St: 3 Bed / 1 Bath; 250 Maple: 2 Bed / 1 Bath; 1040 Bluefield: 3 Bed / 1 Bath; 1205 St. Matthew: 3 Bed / 2 Bath. Each home is tenant-occupied and professionally managed. Properties are in good condition and present immediate capital equity for a savvy investor. Whether you're looking to grow your portfolio or complete a 1031 exchange, this package is ideal for long-term stability and value. Price is firm. Seller is rebalancing portfolio and transitioning to multifamily assets. Additional MLS #'s:
#25024001, #25024012 and #25024022.
Home Details
Home Type
- Single Family
Est. Annual Taxes
- $1,824
Year Built
- Built in 1958
Lot Details
- 7,501 Sq Ft Lot
- Lot Dimensions are 60x125
Home Design
- Ranch Style House
- Traditional Architecture
- Aluminum Siding
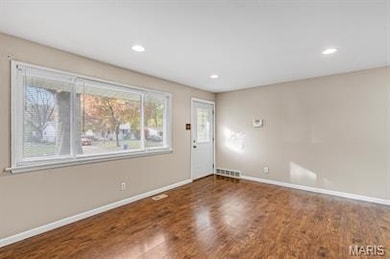
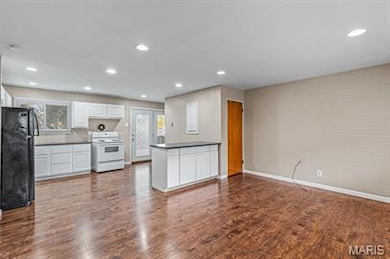
Interior Spaces
- 912 Sq Ft Home
- Partially Finished Basement
- Basement Fills Entire Space Under The House
Bedrooms and Bathrooms
- 3 Bedrooms
- 1 Full Bathroom
Parking
- 1 Parking Space
- 1 Carport Space
Schools
- Parker Road Elem. Elementary School
- Cross Keys Middle School
- Mccluer North High School
Utilities
- Forced Air Heating and Cooling System
- Heating System Uses Natural Gas
- Gas Water Heater
Listing and Financial Details
- Assessor Parcel Number 08J-61-0046
Map
Home Values in the Area
Average Home Value in this Area
Tax History
| Year | Tax Paid | Tax Assessment Tax Assessment Total Assessment is a certain percentage of the fair market value that is determined by local assessors to be the total taxable value of land and additions on the property. | Land | Improvement |
|---|---|---|---|---|
| 2025 | $1,824 | $26,170 | $4,030 | $22,140 |
| 2024 | $1,824 | $23,420 | $2,770 | $20,650 |
| 2023 | $1,824 | $23,420 | $2,770 | $20,650 |
| 2022 | $1,607 | $18,160 | $3,550 | $14,610 |
| 2021 | $1,580 | $18,160 | $3,550 | $14,610 |
| 2020 | $1,511 | $16,380 | $4,030 | $12,350 |
| 2019 | $1,482 | $16,380 | $4,030 | $12,350 |
| 2018 | $1,437 | $14,190 | $2,050 | $12,140 |
| 2017 | $1,430 | $14,190 | $2,050 | $12,140 |
| 2016 | $1,759 | $17,080 | $4,520 | $12,560 |
| 2015 | $1,769 | $17,080 | $4,520 | $12,560 |
| 2014 | $1,526 | $15,180 | $3,930 | $11,250 |
Property History
| Date | Event | Price | List to Sale | Price per Sq Ft |
|---|---|---|---|---|
| 05/08/2025 05/08/25 | Pending | -- | -- | -- |
| 04/19/2025 04/19/25 | For Sale | $550,000 | -- | $603 / Sq Ft |
| 04/17/2025 04/17/25 | Off Market | -- | -- | -- |
Purchase History
| Date | Type | Sale Price | Title Company |
|---|---|---|---|
| Warranty Deed | -- | Freedom Title | |
| Quit Claim Deed | $40,000 | None Available | |
| Warranty Deed | $35,000 | None Available | |
| Trustee Deed | $43,500 | None Available |
Source: MARIS MLS
MLS Number: MIS25024023
APN: 08J-61-0046
Disclaimer: Certain information contained herein is derived from information provided by parties other than Homes.com. All information provided is deemed reliable, but is not guaranteed to be accurate and should be independently verified.
![]() Based on information submitted to the MLS GRID. All data is obtained from various sources and may not have been verified by broker or MLS GRID. Supplied Open House Information is subject to change without notice. All information should be independently reviewed and verified for accuracy. Properties may or may not be listed by the office/agent presenting the information. Some IDX listings have been excluded from this website.
Based on information submitted to the MLS GRID. All data is obtained from various sources and may not have been verified by broker or MLS GRID. Supplied Open House Information is subject to change without notice. All information should be independently reviewed and verified for accuracy. Properties may or may not be listed by the office/agent presenting the information. Some IDX listings have been excluded from this website.
The Digital Millennium Copyright Act of 1998, 17 U.S.C. § 512 (the “DMCA”) provides recourse for copyright owners who believe that material appearing on the Internet infringes their rights under U.S. copyright law. If you believe in good faith that any content or material made available in connection with our website or services infringes your copyright, you (or your agent) may send us a notice requesting that the content or material be removed, or access to it blocked.
Notices must be sent in writing by email to DMCAnotice@MLSGrid.com.
The DMCA requires that your notice of alleged copyright infringement include the following information:
(1) description of the copyrighted work that is the subject of claimed infringement;
(2) description of the alleged infringing content and information sufficient to permit us to locate the content;
(3) contact information for you, including your address, telephone number and email address;
(4) a statement by you that you have a good faith belief that the content in the manner complained of is not authorized by the copyright owner, or its agent, or by the operation of any law;
(5) a statement by you, signed under penalty of perjury, that the information in the notification is accurate and that you have the authority to enforce the copyrights that are claimed to be infringed; and
(6) a physical or electronic signature of the copyright owner or a person authorized to act on the copyright owner’s behalf. Failure to include all of the above information may result in the delay of the processing of your complaint.
- 1305 Burning Tree Dr
- 765 Pimlico Dr
- 675 Pimlico Dr
- 820 Paddock Dr
- 1965 Saint Catherine St
- 1060 Preakness Ln
- 1090 Saint Joseph St
- 1420 Nashua Dr
- 505 Ridge Dr
- 1290 Saint Louis St
- 2340 Saint Catherine St
- 1480 Burning Tree Dr
- 2505 Saint Catherine St
- 1023 Saint Denis St
- 1148 Boone St
- 1400 Paddock Dr
- 2620 Derby Place
- 1205 Fox Run Dr
- 2240 Brook Dr
- 1130 Saint Francois St
