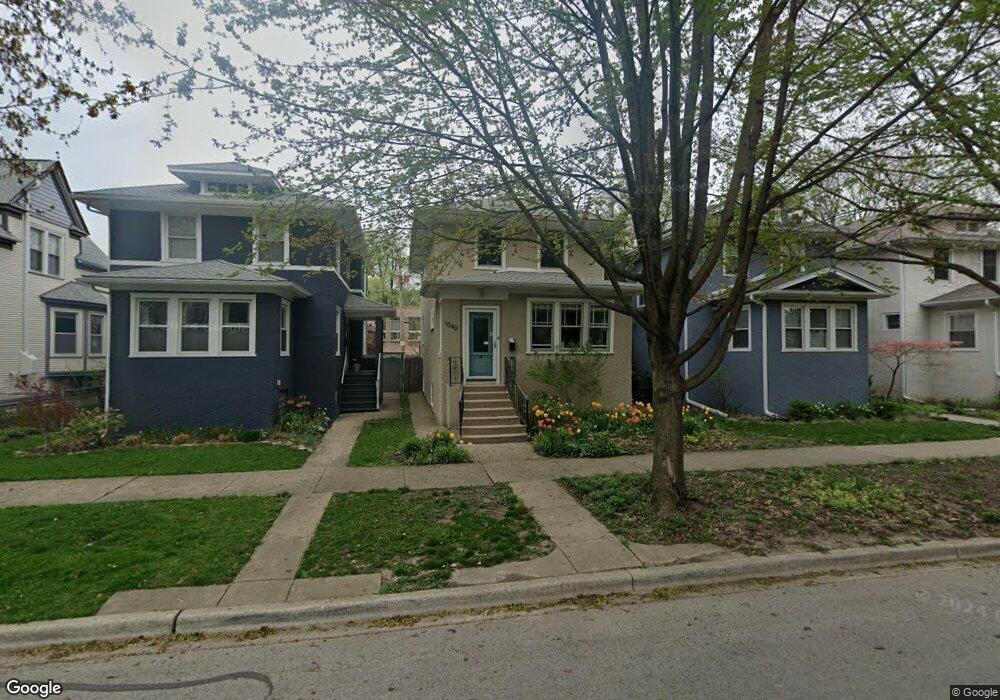
1040 Clarence Ave Oak Park, IL 60304
Estimated Value: $522,000 - $606,000
4
Beds
2
Baths
1,690
Sq Ft
$328/Sq Ft
Est. Value
About This Home
This home is located at 1040 Clarence Ave, Oak Park, IL 60304 and is currently estimated at $554,013, approximately $327 per square foot. 1040 Clarence Ave is a home located in Cook County with nearby schools including Percy Julian Middle School, Oak Park and River Forest High School, and West Suburban Montessori School.
Ownership History
Date
Name
Owned For
Owner Type
Purchase Details
Closed on
Feb 7, 2006
Sold by
Wiemeler Edward G and Wiemeler Eileen C
Bought by
Oconnor James and Oconnor Hannah West
Current Estimated Value
Home Financials for this Owner
Home Financials are based on the most recent Mortgage that was taken out on this home.
Original Mortgage
$319,200
Outstanding Balance
$181,184
Interest Rate
6.34%
Mortgage Type
Fannie Mae Freddie Mac
Estimated Equity
$372,829
Purchase Details
Closed on
May 2, 1999
Sold by
Dennis Michael E
Bought by
Wiemeler Edward G and Wiemeler Eileen C
Home Financials for this Owner
Home Financials are based on the most recent Mortgage that was taken out on this home.
Original Mortgage
$160,000
Interest Rate
7.04%
Create a Home Valuation Report for This Property
The Home Valuation Report is an in-depth analysis detailing your home's value as well as a comparison with similar homes in the area
Home Values in the Area
Average Home Value in this Area
Purchase History
| Date | Buyer | Sale Price | Title Company |
|---|---|---|---|
| Oconnor James | $399,000 | Multiple | |
| Wiemeler Edward G | $200,000 | 1St American Title |
Source: Public Records
Mortgage History
| Date | Status | Borrower | Loan Amount |
|---|---|---|---|
| Open | Oconnor James | $319,200 | |
| Previous Owner | Wiemeler Edward G | $160,000 |
Source: Public Records
Tax History Compared to Growth
Tax History
| Year | Tax Paid | Tax Assessment Tax Assessment Total Assessment is a certain percentage of the fair market value that is determined by local assessors to be the total taxable value of land and additions on the property. | Land | Improvement |
|---|---|---|---|---|
| 2024 | $12,049 | $40,275 | $5,512 | $34,763 |
| 2023 | $11,358 | $40,275 | $5,512 | $34,763 |
| 2022 | $11,358 | $32,999 | $4,134 | $28,865 |
| 2021 | $11,102 | $32,998 | $4,133 | $28,865 |
| 2020 | $12,141 | $36,361 | $4,133 | $32,228 |
| 2019 | $11,546 | $33,524 | $3,740 | $29,784 |
| 2018 | $11,111 | $33,524 | $3,740 | $29,784 |
| 2017 | $11,711 | $35,799 | $3,740 | $32,059 |
| 2016 | $10,159 | $27,739 | $3,149 | $24,590 |
| 2015 | $9,776 | $29,733 | $3,149 | $26,584 |
| 2014 | $9,675 | $31,440 | $3,149 | $28,291 |
| 2013 | $10,047 | $33,500 | $3,149 | $30,351 |
Source: Public Records
Map
Nearby Homes
- 1125 Gunderson Ave
- 920 Wesley Ave Unit 1
- 1156 Wesley Ave
- 1135 S Oak Park Ave
- 1101 S Oak Park Ave
- 1183 S Scoville Ave
- 644 Harrison St Unit 1
- 915 S Oak Park Ave Unit 1-B
- 1133 S Ridgeland Ave
- 1223 S Elmwood Ave Unit TWO
- 808 S Euclid Ave
- 642 Van Buren St Unit 2
- 737 Clarence Ave
- 1141 Highland Ave
- 721 Clarence Ave
- 723 Wesley Ave
- 1143 Clinton Ave
- 6337 Roosevelt Rd Unit 309
- 6337 Roosevelt Rd Unit 103
- 840 S Cuyler Ave
- 1038 Clarence Ave
- 1044 Clarence Ave
- 1046 Clarence Ave
- 1036 Clarence Ave
- 1032 Clarence Ave
- 1037 S East Ave
- 1028 Clarence Ave
- 1033 S East Ave
- 1045 Clarence Ave Unit 404
- 1045 Clarence Ave Unit 307
- 1045 Clarence Ave Unit 205
- 1045 Clarence Ave Unit 201
- 1045 Clarence Ave
- 1104 Clarence Ave
- 613 Harvard St
- 1031 S East Ave
- 1043 Clarence Ave
- 1039 Clarence Ave
- 1037 Clarence Ave
- 1047 Clarence Ave