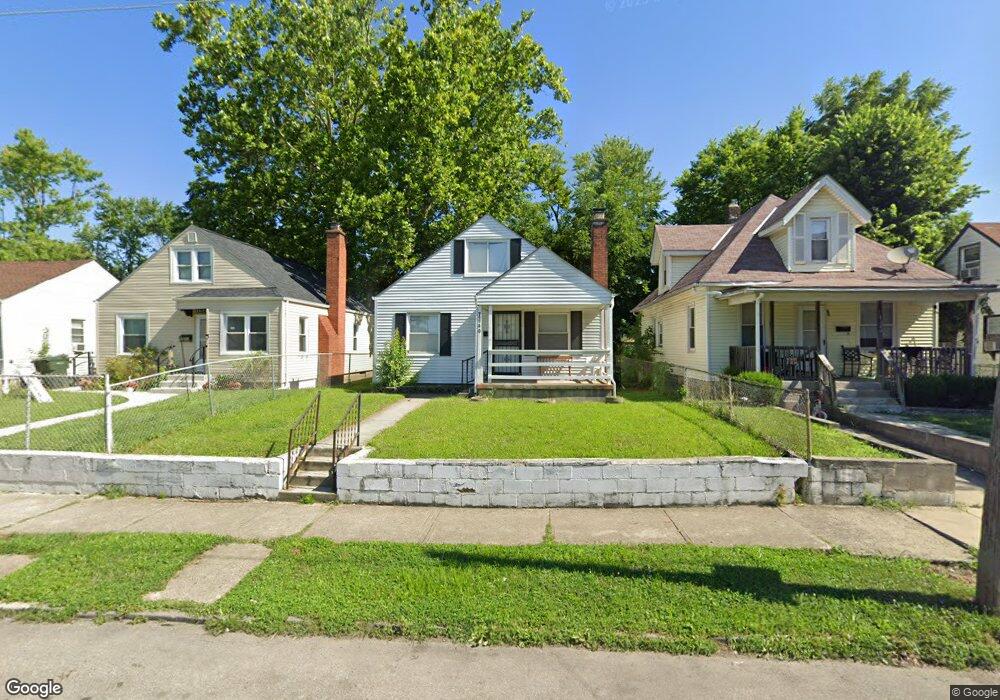
1040 E 13th Ave Columbus, OH 43211
South Linden NeighborhoodEstimated Value: $69,000 - $168,000
3
Beds
1
Bath
1,044
Sq Ft
$113/Sq Ft
Est. Value
About This Home
This home is located at 1040 E 13th Ave, Columbus, OH 43211 and is currently estimated at $118,336, approximately $113 per square foot. 1040 E 13th Ave is a home located in Franklin County with nearby schools including Windsor Stem Acadmey, Linden-Mckinley Stem School On Arcadia, and North Columbus Preparatory Academy.
Ownership History
Date
Name
Owned For
Owner Type
Purchase Details
Closed on
Jul 10, 2023
Sold by
Rjr Phoenix Construction Group Llc
Bought by
Peanuts House Llc
Current Estimated Value
Home Financials for this Owner
Home Financials are based on the most recent Mortgage that was taken out on this home.
Original Mortgage
$131,250
Outstanding Balance
$127,528
Interest Rate
6.69%
Mortgage Type
Credit Line Revolving
Estimated Equity
-$9,192
Purchase Details
Closed on
Dec 30, 2022
Sold by
Bennett Lola
Bought by
Rjr Phoenix Construction Group Llc
Home Financials for this Owner
Home Financials are based on the most recent Mortgage that was taken out on this home.
Original Mortgage
$120,000
Interest Rate
6.33%
Mortgage Type
Construction
Purchase Details
Closed on
Feb 18, 2004
Sold by
Estate Of Alton Bennett
Bought by
Bennett Lola
Purchase Details
Closed on
Jul 8, 1976
Bought by
Bennett Alton and Bennett Lola M
Create a Home Valuation Report for This Property
The Home Valuation Report is an in-depth analysis detailing your home's value as well as a comparison with similar homes in the area
Home Values in the Area
Average Home Value in this Area
Purchase History
| Date | Buyer | Sale Price | Title Company |
|---|---|---|---|
| Peanuts House Llc | -- | Empora Title | |
| Rjr Phoenix Construction Group Llc | $40,000 | Empora Title | |
| Bennett Lola | -- | -- | |
| Bennett Alton | -- | -- |
Source: Public Records
Mortgage History
| Date | Status | Borrower | Loan Amount |
|---|---|---|---|
| Open | Peanuts House Llc | $131,250 | |
| Previous Owner | Rjr Phoenix Construction Group Llc | $120,000 |
Source: Public Records
Tax History
| Year | Tax Paid | Tax Assessment Tax Assessment Total Assessment is a certain percentage of the fair market value that is determined by local assessors to be the total taxable value of land and additions on the property. | Land | Improvement |
|---|---|---|---|---|
| 2025 | $1,243 | $23,840 | $5,640 | $18,200 |
| 2024 | $1,243 | $23,840 | $5,640 | $18,200 |
| 2023 | $1,079 | $23,840 | $5,640 | $18,200 |
| 2022 | $285 | $15,200 | $2,350 | $12,850 |
| 2021 | $287 | $15,200 | $2,350 | $12,850 |
| 2020 | $288 | $15,200 | $2,350 | $12,850 |
| 2019 | $211 | $12,220 | $1,960 | $10,260 |
| 2018 | $105 | $12,220 | $1,960 | $10,260 |
| 2017 | $210 | $12,220 | $1,960 | $10,260 |
| 2016 | $362 | $14,210 | $2,520 | $11,690 |
| 2015 | $164 | $14,210 | $2,520 | $11,690 |
| 2014 | $329 | $14,210 | $2,520 | $11,690 |
| 2013 | $209 | $15,785 | $2,800 | $12,985 |
Source: Public Records
Map
Nearby Homes
- 1027 E 14th Ave
- 957 E 13th Ave
- 1111 Windsor Ave
- 957 E 12th Ave
- 1121 Windsor Ave
- 1538-1542 Accommodation Ave
- 915 E 13th Ave
- 1111-1113 E 16th Ave
- 1070 E 16th Ave
- 928 Chittenden Ave
- 990 E 16th Ave
- 1129 E 17th Ave
- 1705 Lexington Ave
- 1012 E 17th Ave
- 1673 Cleveland Ave
- 957 E 17th Ave
- 1037 E 18th Ave
- 1445-1447 Jefferson Ave
- 1157-1159 E 18th Ave
- 1249-1251 E 15th Ave
- 1034 E 13th Ave
- 1044 E 13th Ave
- 1044 E 13th Ave Unit Ave.
- 1030 E 13th Ave
- 1048 E 13th Ave
- 1024 E 13th Ave
- 1020 E 13th Ave Unit D
- 1020 E 13th Ave
- 1045 E 14th Ave
- 1041 E 14th Ave
- 1049 E 14th Ave
- 1037 E 14th Ave
- 1053 E 14th Ave
- 1057 E 14th Ave Unit 59
- 1057 E 14th Ave Unit 1059
- 1061 E 14th Ave
- 1010 E 13th Ave
- 1025 E 13th Ave Unit 27
- 1059 E 14th Ave
- 1069 E 14th Ave
Your Personal Tour Guide
Ask me questions while you tour the home.