Estimated Value: $302,883 - $320,000
3
Beds
2
Baths
1,610
Sq Ft
$193/Sq Ft
Est. Value
About This Home
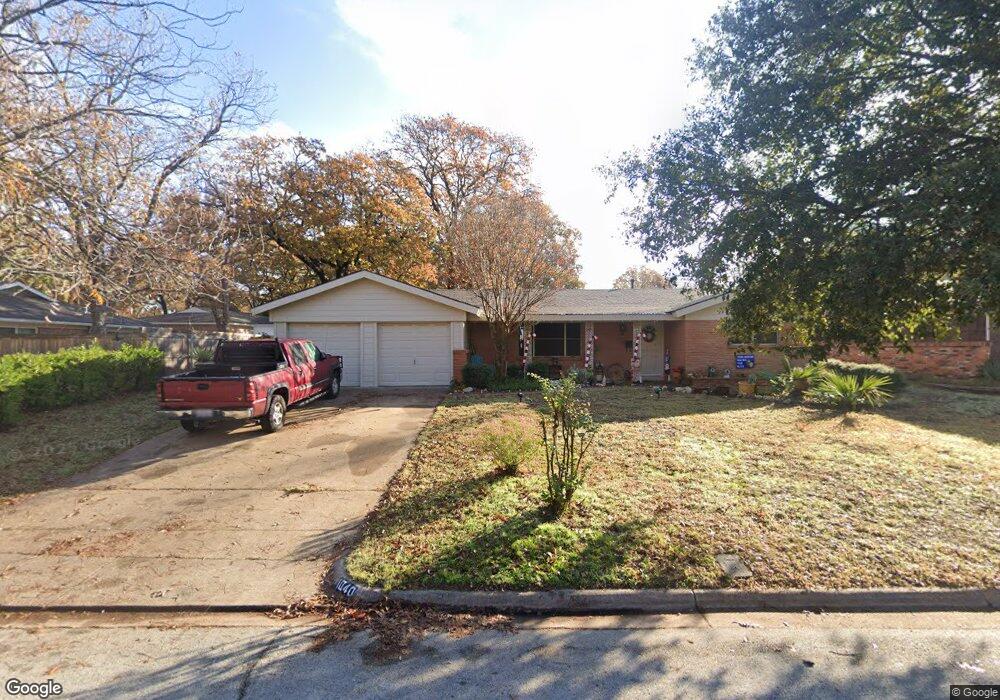
This home is located at 1040 Eunice St, Hurst, TX 76053 and is currently estimated at $309,971, approximately $192 per square foot. 1040 Eunice St is a home located in Tarrant County with nearby schools including Harrison Lane Elementary School, Hurst J High School, and L.D. Bell High School.
Ownership History
Date
Name
Owned For
Owner Type
Purchase Details
Closed on
May 25, 2001
Sold by
Renta Jennifer G
Bought by
Roberts Mark A and Roberts Jennifer A
Current Estimated Value
Home Financials for this Owner
Home Financials are based on the most recent Mortgage that was taken out on this home.
Original Mortgage
$84,000
Outstanding Balance
$31,528
Interest Rate
7.1%
Estimated Equity
$278,443
Purchase Details
Closed on
Dec 14, 2000
Sold by
Minnicks Neil A
Bought by
Renta Jennifer G
Home Financials for this Owner
Home Financials are based on the most recent Mortgage that was taken out on this home.
Original Mortgage
$58,500
Interest Rate
7.72%
Purchase Details
Closed on
Mar 23, 2000
Sold by
Minnicks William Wyatt
Bought by
Minnicks Neil A
Home Financials for this Owner
Home Financials are based on the most recent Mortgage that was taken out on this home.
Original Mortgage
$50,000
Interest Rate
9.7%
Mortgage Type
Credit Line Revolving
Create a Home Valuation Report for This Property
The Home Valuation Report is an in-depth analysis detailing your home's value as well as a comparison with similar homes in the area
Home Values in the Area
Average Home Value in this Area
Purchase History
| Date | Buyer | Sale Price | Title Company |
|---|---|---|---|
| Roberts Mark A | -- | Metroplex Title Inc | |
| Renta Jennifer G | -- | Fidelity National Title | |
| Minnicks Neil A | -- | -- | |
| Minnicks Neil A | -- | -- |
Source: Public Records
Mortgage History
| Date | Status | Borrower | Loan Amount |
|---|---|---|---|
| Open | Roberts Mark A | $84,000 | |
| Previous Owner | Renta Jennifer G | $58,500 | |
| Previous Owner | Minnicks Neil A | $50,000 |
Source: Public Records
Tax History Compared to Growth
Tax History
| Year | Tax Paid | Tax Assessment Tax Assessment Total Assessment is a certain percentage of the fair market value that is determined by local assessors to be the total taxable value of land and additions on the property. | Land | Improvement |
|---|---|---|---|---|
| 2025 | $2,704 | $279,478 | $65,000 | $214,478 |
| 2024 | $2,704 | $279,478 | $65,000 | $214,478 |
| 2023 | $2,704 | $258,975 | $40,000 | $218,975 |
| 2022 | $4,164 | $238,124 | $40,000 | $198,124 |
| 2021 | $3,965 | $212,277 | $40,000 | $172,277 |
| 2020 | $3,596 | $184,264 | $40,000 | $144,264 |
| 2019 | $3,325 | $176,098 | $40,000 | $136,098 |
| 2018 | $2,498 | $123,517 | $19,000 | $104,517 |
| 2017 | $2,841 | $142,179 | $19,000 | $123,179 |
| 2016 | $2,583 | $120,944 | $19,000 | $101,944 |
| 2015 | $2,046 | $92,800 | $15,000 | $77,800 |
| 2014 | $2,046 | $92,800 | $15,000 | $77,800 |
Source: Public Records
Map
Nearby Homes
- 1036 Eunice St
- 1044 Eunice St
- 1041 Cavender Dr
- 1037 Cavender Dr
- 1045 Cavender Dr
- 1032 Eunice St
- 1041 Eunice St
- 1037 Eunice St
- 1045 Eunice St
- 1033 Cavender Dr
- 1033 Eunice St
- 1028 Eunice St
- 324 W Cheryl Ave
- 320 W Cheryl Ave
- 328 W Cheryl Ave
- 1029 Cavender Dr
- 1044 Mary Dr
- 316 W Cheryl Ave
- 1044 Cavender Dr
- 1040 Mary Dr