Estimated Value: $328,000 - $472,000
4
Beds
2
Baths
2,040
Sq Ft
$194/Sq Ft
Est. Value
About This Home
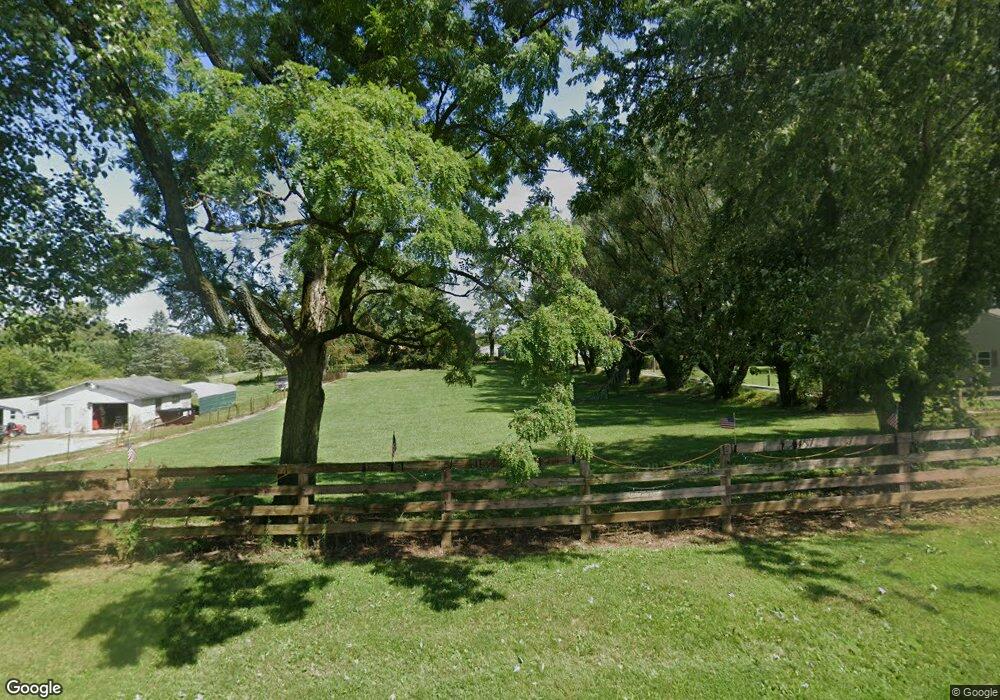
This home is located at 1040 Hook Rd, Xenia, OH 45385 and is currently estimated at $394,954, approximately $193 per square foot. 1040 Hook Rd is a home located in Greene County with nearby schools including Xenia High School, Summit Academy Community School for Alternative Learners - Xenia, and Legacy Christian Academy.
Ownership History
Date
Name
Owned For
Owner Type
Purchase Details
Closed on
Apr 5, 2001
Sold by
Stewart Jeff D and Stewart Sylvie
Bought by
Swafford Johnny M and Swafford Sharon S
Current Estimated Value
Home Financials for this Owner
Home Financials are based on the most recent Mortgage that was taken out on this home.
Original Mortgage
$144,000
Interest Rate
7.05%
Purchase Details
Closed on
Aug 12, 1996
Sold by
Siegel Ann H
Bought by
Stewart Jeff D and Stewart Sylvie
Home Financials for this Owner
Home Financials are based on the most recent Mortgage that was taken out on this home.
Original Mortgage
$114,000
Interest Rate
7.5%
Mortgage Type
New Conventional
Create a Home Valuation Report for This Property
The Home Valuation Report is an in-depth analysis detailing your home's value as well as a comparison with similar homes in the area
Purchase History
| Date | Buyer | Sale Price | Title Company |
|---|---|---|---|
| Swafford Johnny M | $194,000 | Equity Land Title Agency Inc | |
| Stewart Jeff D | $120,000 | -- |
Source: Public Records
Mortgage History
| Date | Status | Borrower | Loan Amount |
|---|---|---|---|
| Previous Owner | Swafford Johnny M | $144,000 | |
| Previous Owner | Stewart Jeff D | $114,000 |
Source: Public Records
Tax History
| Year | Tax Paid | Tax Assessment Tax Assessment Total Assessment is a certain percentage of the fair market value that is determined by local assessors to be the total taxable value of land and additions on the property. | Land | Improvement |
|---|---|---|---|---|
| 2024 | $4,644 | $106,770 | $28,610 | $78,160 |
| 2023 | $4,620 | $106,770 | $28,610 | $78,160 |
| 2022 | $4,090 | $86,560 | $24,880 | $61,680 |
| 2021 | $4,142 | $86,560 | $24,880 | $61,680 |
| 2020 | $3,977 | $86,560 | $24,880 | $61,680 |
| 2019 | $3,265 | $68,690 | $21,980 | $46,710 |
| 2018 | $3,270 | $68,690 | $21,980 | $46,710 |
| 2017 | $3,261 | $68,690 | $21,980 | $46,710 |
| 2016 | $3,261 | $67,380 | $21,460 | $45,920 |
| 2015 | $3,269 | $67,380 | $21,460 | $45,920 |
| 2014 | $3,138 | $67,380 | $21,460 | $45,920 |
Source: Public Records
Map
Nearby Homes
Your Personal Tour Guide
Ask me questions while you tour the home.