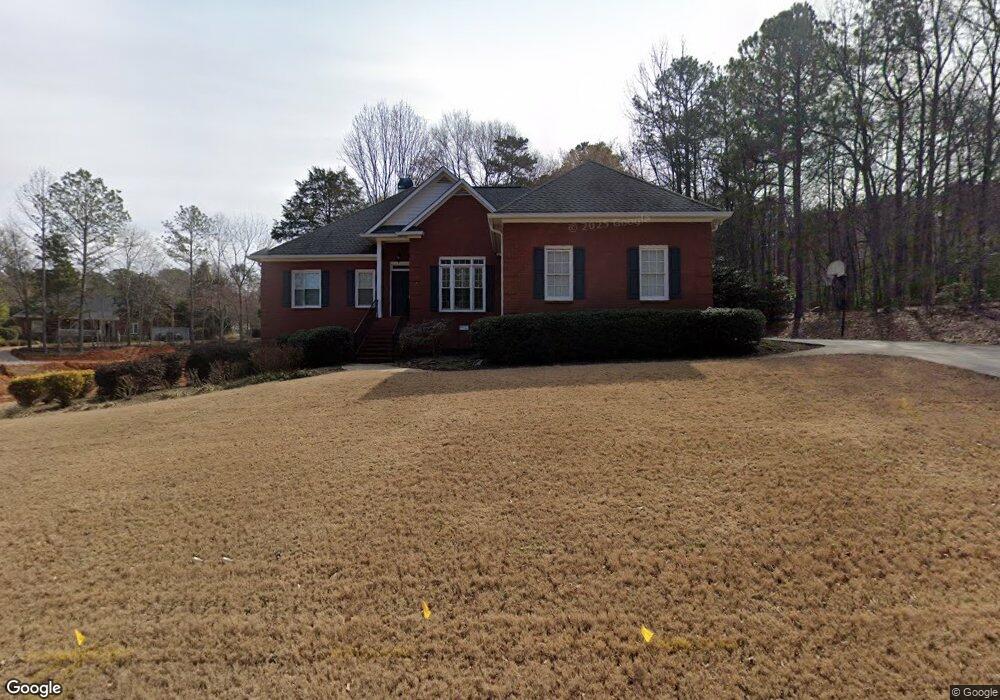
1040 Laurel Springs Ct Bogart, GA 30622
Estimated Value: $561,508 - $624,000
4
Beds
4
Baths
1,957
Sq Ft
$299/Sq Ft
Est. Value
About This Home
This home is located at 1040 Laurel Springs Ct, Bogart, GA 30622 and is currently estimated at $585,127, approximately $298 per square foot. 1040 Laurel Springs Ct is a home located in Oconee County with nearby schools including Rocky Branch Elementary School, Malcom Bridge Middle School, and North Oconee High School.
Ownership History
Date
Name
Owned For
Owner Type
Purchase Details
Closed on
Nov 16, 2023
Sold by
Hamilton Allen
Bought by
Mai Kim Phung Thi and Pham Khanh Cong
Current Estimated Value
Home Financials for this Owner
Home Financials are based on the most recent Mortgage that was taken out on this home.
Original Mortgage
$90,000
Outstanding Balance
$60,896
Interest Rate
7.63%
Mortgage Type
New Conventional
Estimated Equity
$524,231
Purchase Details
Closed on
Jun 21, 2021
Sold by
Hamilton Allen
Bought by
Hamilton Allen and Hamilton Martha
Home Financials for this Owner
Home Financials are based on the most recent Mortgage that was taken out on this home.
Original Mortgage
$390,791
Interest Rate
2.9%
Mortgage Type
FHA
Purchase Details
Closed on
Jul 19, 2001
Sold by
Alan Reddish W and Alan Alan
Bought by
Amini Bijan and Amini Diana
Purchase Details
Closed on
Jul 20, 1998
Sold by
Green Development Pa
Bought by
Reddish Reddish W and Reddish Alan
Create a Home Valuation Report for This Property
The Home Valuation Report is an in-depth analysis detailing your home's value as well as a comparison with similar homes in the area
Home Values in the Area
Average Home Value in this Area
Purchase History
| Date | Buyer | Sale Price | Title Company |
|---|---|---|---|
| Mai Kim Phung Thi | $510,000 | -- | |
| Hamilton Allen | -- | -- | |
| Hamilton Allen | $525,000 | -- | |
| Amini Bijan | $268,000 | -- | |
| Reddish Reddish W | $216,700 | -- |
Source: Public Records
Mortgage History
| Date | Status | Borrower | Loan Amount |
|---|---|---|---|
| Open | Mai Kim Phung Thi | $90,000 | |
| Previous Owner | Hamilton Allen | $390,791 |
Source: Public Records
Tax History Compared to Growth
Tax History
| Year | Tax Paid | Tax Assessment Tax Assessment Total Assessment is a certain percentage of the fair market value that is determined by local assessors to be the total taxable value of land and additions on the property. | Land | Improvement |
|---|---|---|---|---|
| 2024 | $3,900 | $204,490 | $30,000 | $174,490 |
| 2023 | $3,842 | $189,489 | $26,000 | $163,489 |
| 2022 | $3,591 | $167,994 | $26,000 | $141,994 |
| 2021 | $2,797 | $119,499 | $24,000 | $95,499 |
| 2020 | $2,657 | $113,288 | $24,000 | $89,288 |
| 2019 | $2,654 | $113,150 | $24,000 | $89,150 |
| 2018 | $2,554 | $106,536 | $24,000 | $82,536 |
| 2017 | $2,392 | $99,699 | $24,000 | $75,699 |
| 2016 | $2,220 | $92,439 | $24,000 | $68,439 |
| 2015 | $2,230 | $92,673 | $24,000 | $68,673 |
| 2014 | $2,214 | $89,924 | $24,000 | $65,924 |
| 2013 | -- | $91,676 | $28,000 | $63,676 |
Source: Public Records
Map
Nearby Homes
- 2550 Hodges Mill Rd
- 2620 Hodges Mill Rd
- 1061 Bent Creek Rd
- 1120 Lancaster Ct
- 1271 Daandra Dr
- 1051 Riverhaven Ln
- 3131 Rocky Branch Rd Unit 140
- 3131 Rocky Branch Rd Unit 280
- 1020 Barber Creek Dr Unit 211
- 1080 Barber Creek Dr
- 1091 Barber Creek Dr
- 1895 Vintage Place
- 1336 Prince Place
- 0 Mars Hill Rd Unit 1025421
- 0 Mars Hill Rd Unit 10509287
- 1941 Mars Hill Rd
- 1070 Sagefield Dr
- 1031 Sagefield Dr
- 1231 Founders Lake Dr
- 1040 Laurel Springs Ct
- 1030 Laurel Springs Ct
- 0 Laurel Springs Ct Unit 7107168
- 0 Laurel Springs Ct
- 0 Laurel Springs Ct
- 1010 Laurel Point
- 1010 Laurel Pointe
- 1020 Laurel Springs Ct
- 1020 Laurel Pointe
- 1020 Laurel Point
- 1010 Laurel Pointe
- 1010 Laurel Pointe
- 1041 Laurel Springs Ct
- 1041 Laurel Springs Ct
- 1020 Laurel Pointe
- 1061 Laurel Pointe
- 1080 Laurel Springs Ct
- 1061 Laurel Pointe
- 1031 Laurel Springs Ct
- 2158 Hodges Mill Rd