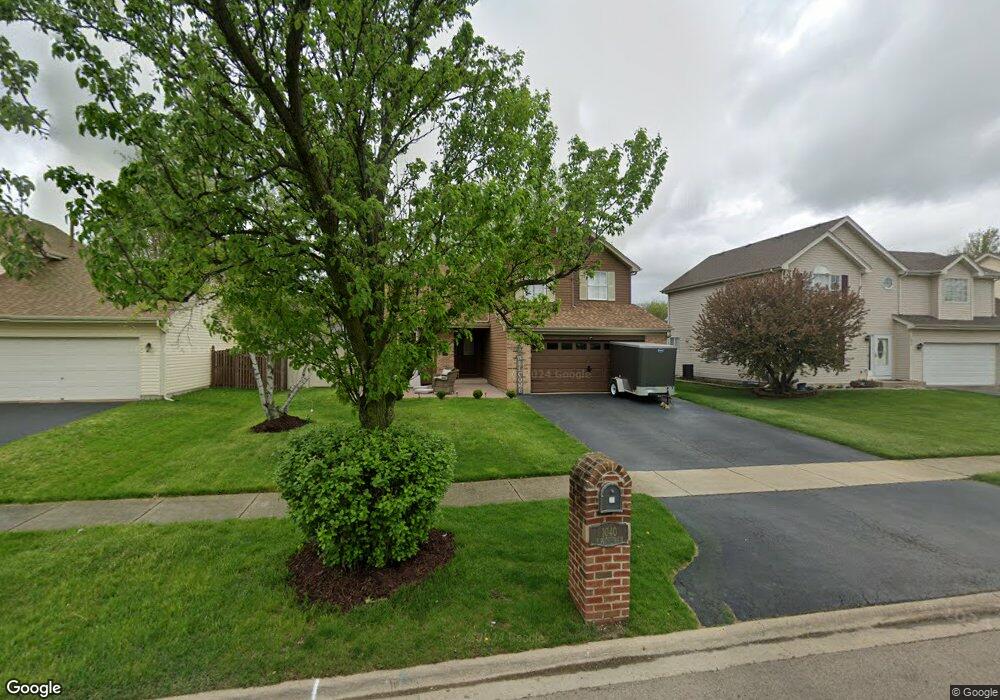
1040 N Commonwealth Ave Aurora, IL 60506
Edgelawn Randall NeighborhoodEstimated Value: $385,000 - $422,000
4
Beds
3
Baths
2,249
Sq Ft
$180/Sq Ft
Est. Value
About This Home
This home is located at 1040 N Commonwealth Ave, Aurora, IL 60506 and is currently estimated at $404,057, approximately $179 per square foot. 1040 N Commonwealth Ave is a home located in Kane County with nearby schools including Mccleery Elementary School, Jefferson Middle School, and West Aurora High School.
Ownership History
Date
Name
Owned For
Owner Type
Purchase Details
Closed on
Dec 18, 2000
Sold by
Smith Eric Q and Smith Sybille R
Bought by
Childress John H and Childress Pamela M
Current Estimated Value
Home Financials for this Owner
Home Financials are based on the most recent Mortgage that was taken out on this home.
Original Mortgage
$206,750
Interest Rate
6.99%
Mortgage Type
FHA
Purchase Details
Closed on
May 27, 1999
Sold by
Vaughn Bryan Joseph and Vaughn Jennifer F
Bought by
Smith Eric Q and Smith Sybille R
Home Financials for this Owner
Home Financials are based on the most recent Mortgage that was taken out on this home.
Original Mortgage
$157,500
Interest Rate
6.92%
Mortgage Type
Balloon
Purchase Details
Closed on
Aug 9, 1996
Sold by
Lasalle National Trust Na
Bought by
Vaughn Bryan Joseph and Vaughn Jennifer F
Home Financials for this Owner
Home Financials are based on the most recent Mortgage that was taken out on this home.
Original Mortgage
$188,900
Interest Rate
8.47%
Mortgage Type
VA
Create a Home Valuation Report for This Property
The Home Valuation Report is an in-depth analysis detailing your home's value as well as a comparison with similar homes in the area
Home Values in the Area
Average Home Value in this Area
Purchase History
| Date | Buyer | Sale Price | Title Company |
|---|---|---|---|
| Childress John H | $210,000 | First American Title Ins Co | |
| Smith Eric Q | $187,500 | -- | |
| Vaughn Bryan Joseph | $183,500 | First American Title Ins Co |
Source: Public Records
Mortgage History
| Date | Status | Borrower | Loan Amount |
|---|---|---|---|
| Previous Owner | Childress John H | $206,750 | |
| Previous Owner | Smith Eric Q | $157,500 | |
| Previous Owner | Vaughn Bryan Joseph | $188,900 |
Source: Public Records
Tax History Compared to Growth
Tax History
| Year | Tax Paid | Tax Assessment Tax Assessment Total Assessment is a certain percentage of the fair market value that is determined by local assessors to be the total taxable value of land and additions on the property. | Land | Improvement |
|---|---|---|---|---|
| 2024 | $9,003 | $123,701 | $18,563 | $105,138 |
| 2023 | $8,610 | $110,526 | $16,586 | $93,940 |
| 2022 | $8,219 | $100,845 | $15,133 | $85,712 |
| 2021 | $7,847 | $93,888 | $14,089 | $79,799 |
| 2020 | $7,415 | $87,208 | $13,087 | $74,121 |
| 2019 | $7,236 | $82,002 | $12,125 | $69,877 |
| 2018 | $6,667 | $74,788 | $11,215 | $63,573 |
| 2017 | $7,758 | $83,381 | $10,334 | $73,047 |
| 2016 | $6,829 | $72,278 | $8,858 | $63,420 |
| 2015 | -- | $62,970 | $7,617 | $55,353 |
| 2014 | -- | $57,295 | $7,326 | $49,969 |
| 2013 | -- | $60,420 | $7,221 | $53,199 |
Source: Public Records
Map
Nearby Homes
- 1296 Yellowpine Dr
- 795 N Elmwood Dr
- 781 N Elmwood Dr
- 1351 Monomoy St Unit D
- 1104 New Haven Ave
- 910 Southbridge Dr
- 1389 Monomoy St Unit B2
- 833 N Randall Rd Unit C4
- 1035 Newcastle Ln
- 972 Westgate Dr
- 1532 Golden Oaks Pkwy
- 1199 Pin Oak Trail
- 616 Morton Ave
- 943 Charles St
- 967 Sapphire Ln
- 959 Sapphire Ln
- 963 Sapphire Ln
- 960 Sapphire Ln
- 964 Sapphire Ln
- 809 W Park Ave
- 1050 N Commonwealth Ave
- 1030 N Commonwealth Ave
- 1045 Legrande Ave
- 1060 N Commonwealth Ave
- 1020 N Commonwealth Ave
- 1053 Legrande Ave
- 1029 Legrande Ave
- 1061 Legrande Ave
- 1070 N Commonwealth Ave
- 1010 N Commonwealth Ave
- 1021 Legrande Ave
- 1080 N Commonwealth Ave
- 1000 N Commonwealth Ave
- 1077 Legrande Ave
- 1013 Legrande Ave
- 1048 Legrande Ave
- 1211 Cottonwood Dr
- 1090 N Commonwealth Ave
- 1034 Legrande Ave