1040 Olde Roswell Grove Roswell, GA 30075
Estimated Value: $548,000 - $657,000
4
Beds
3
Baths
1,841
Sq Ft
$325/Sq Ft
Est. Value
About This Home
This home is located at 1040 Olde Roswell Grove, Roswell, GA 30075 and is currently estimated at $597,533, approximately $324 per square foot. 1040 Olde Roswell Grove is a home located in Fulton County with nearby schools including Roswell North Elementary School, Crabapple Middle School, and Fulton Academy of Science and Technology.
Ownership History
Date
Name
Owned For
Owner Type
Purchase Details
Closed on
Dec 8, 2004
Sold by
Mehyar Tamer Y
Bought by
Wieland Louis
Current Estimated Value
Home Financials for this Owner
Home Financials are based on the most recent Mortgage that was taken out on this home.
Original Mortgage
$227,867
Outstanding Balance
$112,898
Interest Rate
5.57%
Mortgage Type
VA
Estimated Equity
$484,635
Purchase Details
Closed on
Oct 25, 2000
Sold by
Yue Calvin
Bought by
Mehyar Tamer Y
Home Financials for this Owner
Home Financials are based on the most recent Mortgage that was taken out on this home.
Original Mortgage
$196,000
Interest Rate
7.83%
Mortgage Type
New Conventional
Purchase Details
Closed on
Jan 31, 1996
Sold by
Morrison Homesof Florida Inc
Bought by
Yue Calvin
Create a Home Valuation Report for This Property
The Home Valuation Report is an in-depth analysis detailing your home's value as well as a comparison with similar homes in the area
Home Values in the Area
Average Home Value in this Area
Purchase History
| Date | Buyer | Sale Price | Title Company |
|---|---|---|---|
| Wieland Louis | $250,000 | -- | |
| Mehyar Tamer Y | $206,400 | -- | |
| Yue Calvin | $154,000 | -- |
Source: Public Records
Mortgage History
| Date | Status | Borrower | Loan Amount |
|---|---|---|---|
| Open | Wieland Louis | $227,867 | |
| Previous Owner | Mehyar Tamer Y | $196,000 | |
| Closed | Yue Calvin | $0 |
Source: Public Records
Tax History Compared to Growth
Tax History
| Year | Tax Paid | Tax Assessment Tax Assessment Total Assessment is a certain percentage of the fair market value that is determined by local assessors to be the total taxable value of land and additions on the property. | Land | Improvement |
|---|---|---|---|---|
| 2025 | $620 | $191,200 | $53,840 | $137,360 |
| 2023 | $5,820 | $206,200 | $42,680 | $163,520 |
| 2022 | $2,511 | $129,160 | $31,520 | $97,640 |
| 2021 | $2,959 | $125,400 | $30,600 | $94,800 |
| 2020 | $3,006 | $123,920 | $30,240 | $93,680 |
| 2019 | $468 | $121,680 | $29,680 | $92,000 |
| 2018 | $2,948 | $118,840 | $29,000 | $89,840 |
| 2017 | $2,255 | $89,240 | $24,840 | $64,400 |
| 2016 | $2,254 | $89,240 | $24,840 | $64,400 |
| 2015 | $2,750 | $89,240 | $24,840 | $64,400 |
| 2014 | $2,345 | $89,240 | $24,840 | $64,400 |
Source: Public Records
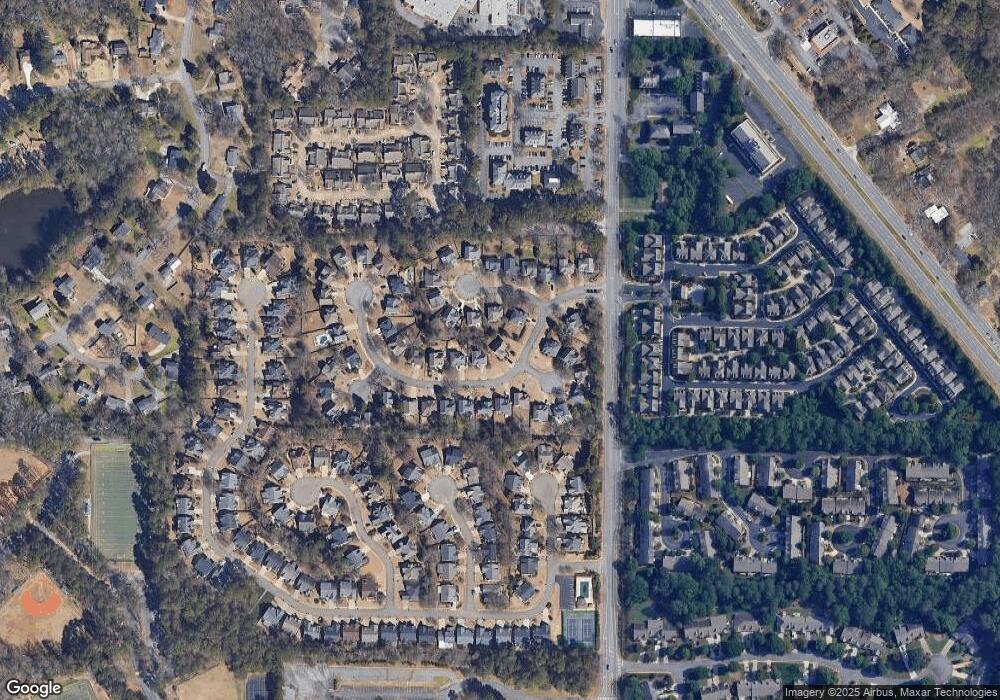
Map
Nearby Homes
- 178 Victoria Way
- 310 Bloomfield Ct
- 110 Great Oaks Ln
- 115 Great Oaks Ln
- 8730 Parker Place
- 515 Wavetree Dr
- 200 Bent Grass Dr
- 120 Gala Ct
- 1002 Towneship Way
- 1012 Towneship Way
- 3095 Bellingrath Blvd
- 5000 Lexington Dr
- 1000 Sterling Ct
- 10485 Woodstock Rd
- 230 Park Bridge Ln
- 130 Elizabeth Cove
- 5022 Towneship Creek Rd
- 925 Brandon Ridge Dr
- 1050 Olde Roswell Grove
- 0 Blairshire Close
- 105 Ashbrook Ln
- 115 Ashbrook Ln
- 125 Ashbrook Ln
- 1060 Olde Roswell Grove
- 205 Blairshire Close
- 200 Blairshire Close
- 135 Ashbrook Ln
- 0 Ashbrook Ln Unit 8816728
- 0 Ashbrook Ln Unit 8023239
- 1035 Olde Roswell Grove
- 1070 Olde Roswell Grove
- 1045 Olde Roswell Grove
- 210 Blairshire Close
- 215 Blairshire Close
- 1055 Olde Roswell Grove
- 220 Blairshire Close
- 1005 Olde Roswell Grove
- 1065 Olde Roswell Grove