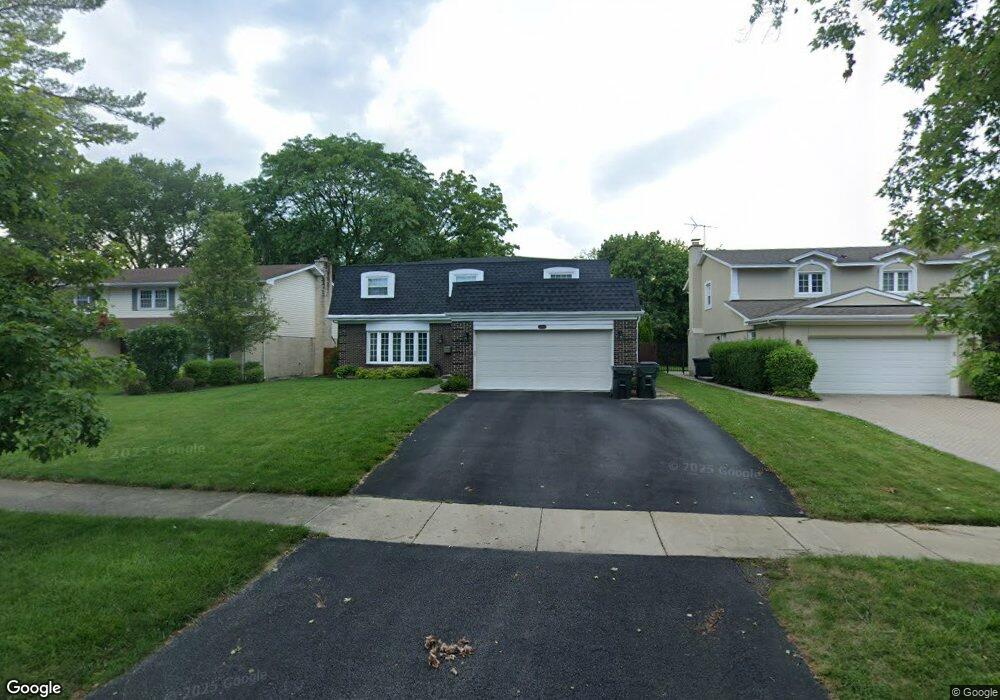
1040 Rolling Pass Glenview, IL 60025
Estimated Value: $739,000 - $1,012,000
4
Beds
3
Baths
2,928
Sq Ft
$296/Sq Ft
Est. Value
About This Home
This home is located at 1040 Rolling Pass, Glenview, IL 60025 and is currently estimated at $865,919, approximately $295 per square foot. 1040 Rolling Pass is a home located in Cook County with nearby schools including Henking Elementary School, Hoffman Elementary School, and Attea Middle School.
Ownership History
Date
Name
Owned For
Owner Type
Purchase Details
Closed on
Aug 29, 2017
Sold by
Clark Christopher D and Clark Rachel C
Bought by
Groboski John A and Groboski Michelle M
Current Estimated Value
Home Financials for this Owner
Home Financials are based on the most recent Mortgage that was taken out on this home.
Original Mortgage
$448,000
Outstanding Balance
$371,128
Interest Rate
3.96%
Mortgage Type
New Conventional
Estimated Equity
$494,791
Purchase Details
Closed on
Jun 15, 2010
Sold by
Lacey Lawrence L and Lacey Barbara
Bought by
Clark Christopher D and Clark Rachel C
Home Financials for this Owner
Home Financials are based on the most recent Mortgage that was taken out on this home.
Original Mortgage
$417,000
Interest Rate
4.83%
Mortgage Type
New Conventional
Create a Home Valuation Report for This Property
The Home Valuation Report is an in-depth analysis detailing your home's value as well as a comparison with similar homes in the area
Home Values in the Area
Average Home Value in this Area
Purchase History
| Date | Buyer | Sale Price | Title Company |
|---|---|---|---|
| Groboski John A | $561,000 | Greater Metropolitan Title L | |
| Clark Christopher D | $546,500 | Chicago Title Insurance Co |
Source: Public Records
Mortgage History
| Date | Status | Borrower | Loan Amount |
|---|---|---|---|
| Open | Groboski John A | $448,000 | |
| Previous Owner | Clark Christopher D | $417,000 |
Source: Public Records
Tax History
| Year | Tax Paid | Tax Assessment Tax Assessment Total Assessment is a certain percentage of the fair market value that is determined by local assessors to be the total taxable value of land and additions on the property. | Land | Improvement |
|---|---|---|---|---|
| 2025 | $12,753 | $87,000 | $16,553 | $70,447 |
| 2024 | $12,753 | $60,934 | $13,939 | $46,995 |
| 2023 | $12,371 | $60,934 | $13,939 | $46,995 |
| 2022 | $12,371 | $60,934 | $13,939 | $46,995 |
| 2021 | $12,957 | $55,389 | $11,325 | $44,064 |
| 2020 | $12,860 | $55,389 | $11,325 | $44,064 |
| 2019 | $11,980 | $60,867 | $11,325 | $49,542 |
| 2018 | $12,112 | $56,100 | $9,801 | $46,299 |
| 2017 | $13,938 | $65,638 | $9,801 | $55,837 |
| 2016 | $14,194 | $69,600 | $9,801 | $59,799 |
| 2015 | $12,855 | $56,603 | $7,840 | $48,763 |
| 2014 | $12,632 | $56,603 | $7,840 | $48,763 |
| 2013 | $12,233 | $56,603 | $7,840 | $48,763 |
Source: Public Records
Map
Nearby Homes
- 1024 Prairie Lawn Rd
- 2710 Langley Cir Unit 201003
- 1340 Huber Ln
- 3202 Dell Place
- 1066 Shermer Rd Unit FE
- 3212 Lindenwood Ln
- 911 Elmdale Rd
- 705 Glendale Rd
- 2824 Central Rd
- 1597 Monterey Dr
- 2701 Commons Dr Unit 210
- 1619 Patriot Blvd
- 2238 Prairie St
- 3415 Ralmark Ln
- 602 Glenshire Rd
- 1615 Greenwood Rd
- 525 Glenshire Rd
- 2537 Pick Dr
- 3505 Linneman St
- 1867 Admiral Ct Unit 91
- 1036 Rolling Pass
- 1044 Rolling Pass
- 1032 Rolling Pass
- 1105 Prairie Lawn Rd
- 1048 Rolling Pass
- 1045 Prairie Lawn Rd
- 1111 Prairie Lawn Rd
- 1028 Rolling Pass
- 1043 Rolling Pass
- 1041 Prairie Lawn Rd
- 1052 Rolling Pass
- 1119 Prairie Lawn Rd
- 1045 Rolling Pass
- 1029 Rolling Pass
- 1056 Rolling Pass
- 1024 Rolling Pass
- 1051 Rolling Pass
- 1025 Rolling Pass
- 1125 Prairie Lawn Rd
- 1020 Rolling Pass
Your Personal Tour Guide
Ask me questions while you tour the home.