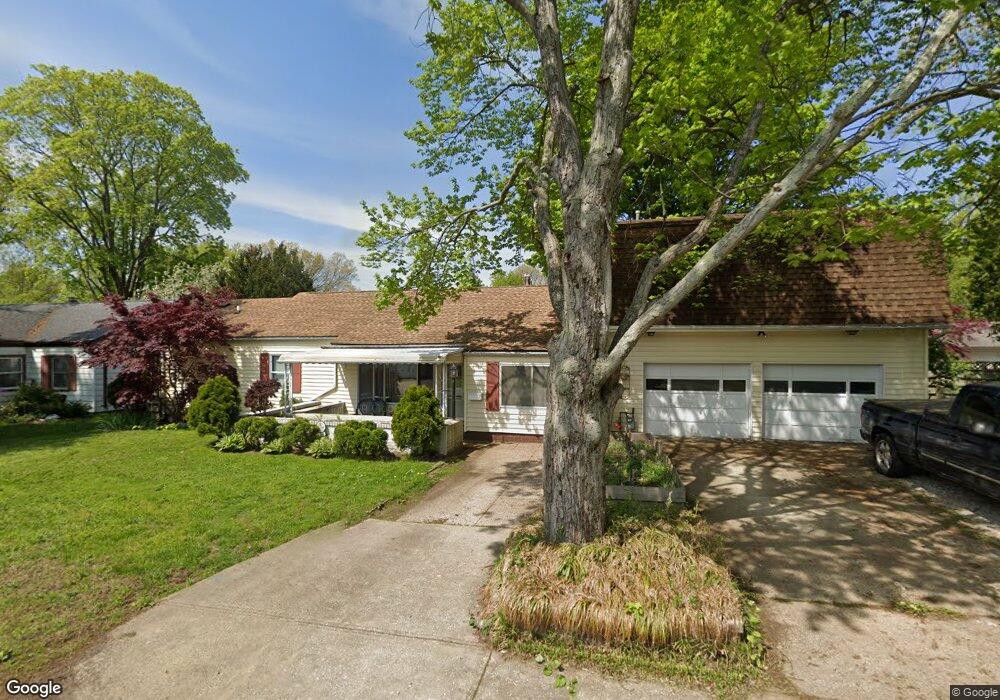
1040 Tioga Trail Willoughby, OH 44094
Estimated Value: $223,350 - $267,000
3
Beds
2
Baths
1,888
Sq Ft
$130/Sq Ft
Est. Value
About This Home
This home is located at 1040 Tioga Trail, Willoughby, OH 44094 and is currently estimated at $245,338, approximately $129 per square foot. 1040 Tioga Trail is a home located in Lake County with nearby schools including Grant Elementary School, Willoughby Middle School, and South High School.
Ownership History
Date
Name
Owned For
Owner Type
Purchase Details
Closed on
Feb 23, 2005
Sold by
Cendant Mobility Financial Corp
Bought by
Renwick John W
Current Estimated Value
Home Financials for this Owner
Home Financials are based on the most recent Mortgage that was taken out on this home.
Original Mortgage
$146,144
Outstanding Balance
$77,867
Interest Rate
6.49%
Mortgage Type
Purchase Money Mortgage
Estimated Equity
$167,471
Purchase Details
Closed on
Jul 27, 2004
Sold by
Khodaei Ahmad and Khodaei Marybelle
Bought by
Cendant Mobility Financial Corp
Purchase Details
Closed on
Aug 9, 2002
Sold by
Noble Larry D and Noble Joyce A
Bought by
Khodaei Ahmad and Khodaei Marybelle
Home Financials for this Owner
Home Financials are based on the most recent Mortgage that was taken out on this home.
Original Mortgage
$152,000
Interest Rate
6.62%
Purchase Details
Closed on
Jan 1, 1990
Bought by
Noble Larry D
Create a Home Valuation Report for This Property
The Home Valuation Report is an in-depth analysis detailing your home's value as well as a comparison with similar homes in the area
Home Values in the Area
Average Home Value in this Area
Purchase History
| Date | Buyer | Sale Price | Title Company |
|---|---|---|---|
| Renwick John W | $146,200 | First American Title | |
| Cendant Mobility Financial Corp | $146,200 | First American Title | |
| Khodaei Ahmad | $160,000 | Midland Title Security Inc | |
| Noble Larry D | -- | -- |
Source: Public Records
Mortgage History
| Date | Status | Borrower | Loan Amount |
|---|---|---|---|
| Open | Renwick John W | $146,144 | |
| Previous Owner | Khodaei Ahmad | $152,000 |
Source: Public Records
Tax History Compared to Growth
Tax History
| Year | Tax Paid | Tax Assessment Tax Assessment Total Assessment is a certain percentage of the fair market value that is determined by local assessors to be the total taxable value of land and additions on the property. | Land | Improvement |
|---|---|---|---|---|
| 2024 | -- | $71,940 | $10,130 | $61,810 |
| 2023 | $4,517 | $47,710 | $8,600 | $39,110 |
| 2022 | $2,943 | $47,710 | $8,600 | $39,110 |
| 2021 | $3,963 | $47,710 | $8,600 | $39,110 |
| 2020 | $3,451 | $39,110 | $7,050 | $32,060 |
| 2019 | $3,447 | $39,110 | $7,050 | $32,060 |
| 2018 | $3,356 | $43,230 | $12,310 | $30,920 |
| 2017 | $3,675 | $43,230 | $12,310 | $30,920 |
| 2016 | $3,392 | $43,230 | $12,310 | $30,920 |
| 2015 | $2,812 | $43,230 | $12,310 | $30,920 |
| 2014 | $2,579 | $41,780 | $12,310 | $29,470 |
| 2013 | $2,581 | $41,780 | $12,310 | $29,470 |
Source: Public Records
Map
Nearby Homes
- 871 Birchwood Dr
- 6430 S Cedarwood Rd
- 1263 Lost Nation Rd Unit 5
- 951 Shadowrow Ave
- 700 Cherokee Trail
- 38598 Granite Dr Unit 31
- 38514 N Beachview Rd
- 928 Hayes Ave
- 38407 N Beachview Rd
- 1068 Elmwood Dr
- 6143 Seminole Trail
- 6086 Seminole Trail
- 6195 Thunderbird Dr
- 38256 Lake Shore Blvd
- 1298 Beech St
- 6672 Reynolds Rd
- 1245 Leeward Ln Unit A
- 1285 Leeward Ln Unit B
- 6542 Inland Shores Dr
- 0 V L Lake Shore Blvd Unit 5070796
- 1046 Tioga Trail
- 1022 Tioga Trail
- 1039 Mohegan Trail
- 1027 Mohegan Trail
- 1012 Tioga Trail
- 1045 Mohegan Trail
- 1041 Tioga Trail
- 1052 Tioga Trail
- 1047 Tioga Trail
- 1023 Tioga Trail
- 1059 Mohegan Trail
- 1010 Tioga Trail
- 1009 Mohegan Trail
- 1059 Tioga Trail
- 1070 Tioga Trail
- 1063 Mohegan Trail
- 1011 Tioga Trail
- 1038 Mohegan Trail
- 1026 Mohegan Trail
- 998 Tioga Trail