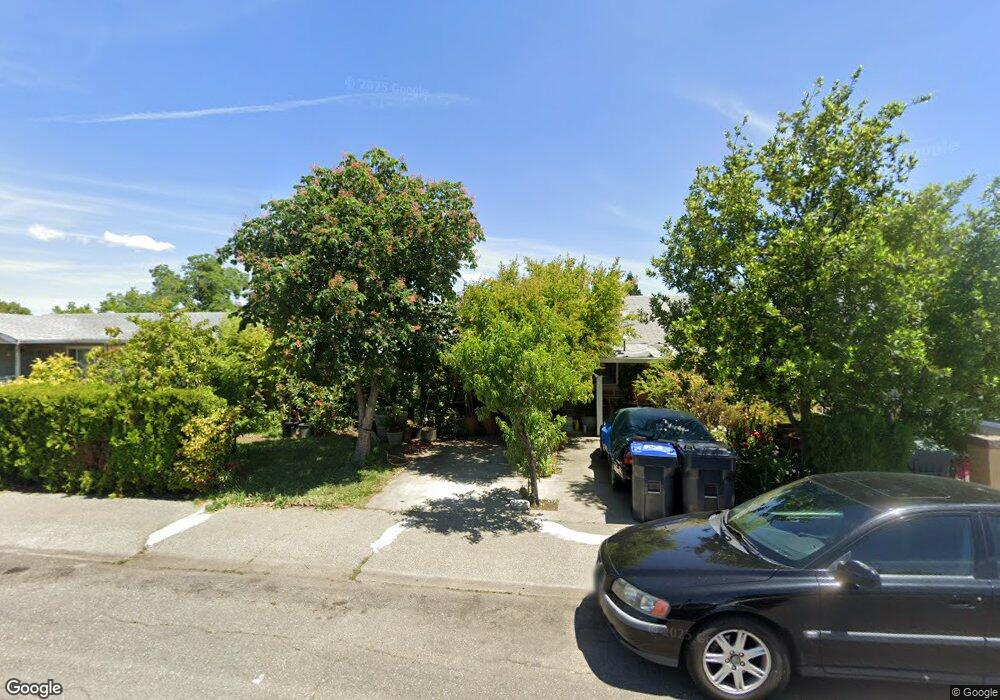
1040 Tyler St Fairfield, CA 94533
Estimated Value: $424,000 - $478,000
3
Beds
1
Bath
1,440
Sq Ft
$312/Sq Ft
Est. Value
About This Home
This home is located at 1040 Tyler St, Fairfield, CA 94533 and is currently estimated at $448,667, approximately $311 per square foot. 1040 Tyler St is a home located in Solano County with nearby schools including Fairview Elementary School, Crystal Middle School, and Armijo High School.
Ownership History
Date
Name
Owned For
Owner Type
Purchase Details
Closed on
Nov 27, 2000
Sold by
Vasquez Emiliano
Bought by
Vasquez Emiliano and Vasquez Gloria
Current Estimated Value
Home Financials for this Owner
Home Financials are based on the most recent Mortgage that was taken out on this home.
Original Mortgage
$50,000
Interest Rate
11.85%
Purchase Details
Closed on
Sep 29, 1999
Sold by
Jose Vasquez and Vasquez Gabriel
Bought by
Vasquez Emiliano
Create a Home Valuation Report for This Property
The Home Valuation Report is an in-depth analysis detailing your home's value as well as a comparison with similar homes in the area
Home Values in the Area
Average Home Value in this Area
Purchase History
| Date | Buyer | Sale Price | Title Company |
|---|---|---|---|
| Vasquez Emiliano | -- | North American Title Co | |
| Vasquez Emiliano | $14,500 | -- |
Source: Public Records
Mortgage History
| Date | Status | Borrower | Loan Amount |
|---|---|---|---|
| Closed | Vasquez Emiliano | $50,000 | |
| Closed | Vasquez Emiliano | $240,000 |
Source: Public Records
Tax History
| Year | Tax Paid | Tax Assessment Tax Assessment Total Assessment is a certain percentage of the fair market value that is determined by local assessors to be the total taxable value of land and additions on the property. | Land | Improvement |
|---|---|---|---|---|
| 2025 | $1,187 | $103,969 | $44,403 | $59,566 |
| 2024 | $1,187 | $101,932 | $43,533 | $58,399 |
| 2023 | $1,151 | $99,934 | $42,680 | $57,254 |
| 2022 | $1,137 | $97,976 | $41,844 | $56,132 |
| 2021 | $1,126 | $96,056 | $41,024 | $55,032 |
| 2020 | $1,100 | $95,072 | $40,604 | $54,468 |
| 2019 | $1,074 | $93,208 | $39,808 | $53,400 |
| 2018 | $1,108 | $91,381 | $39,028 | $52,353 |
| 2017 | $1,058 | $89,590 | $38,263 | $51,327 |
| 2016 | $1,041 | $87,834 | $37,513 | $50,321 |
| 2015 | $973 | $86,516 | $36,950 | $49,566 |
| 2014 | $964 | $84,823 | $36,227 | $48,596 |
Source: Public Records
Map
Nearby Homes
- 1024 Tyler St
- 1042 Hayes St
- 1308 Empire St
- 1443 Minnesota St
- 1049 Buchanan St
- 0 Webster St Unit 41120649
- 1500 Harrison St
- 1201 Missouri St
- 712 Maryland St
- 1217 Dana Dr
- 1625 Minnesota St
- 0 Madison St
- 1654 Minnesota St
- 1745 Utah St
- 1600 Michigan St
- 1124 Union Ave
- 724 Delaware St
- TBD Tract 8 Fcr 445
- 1443 Woolner Ave
- 423 Gregory Ln Unit 28L
Your Personal Tour Guide
Ask me questions while you tour the home.