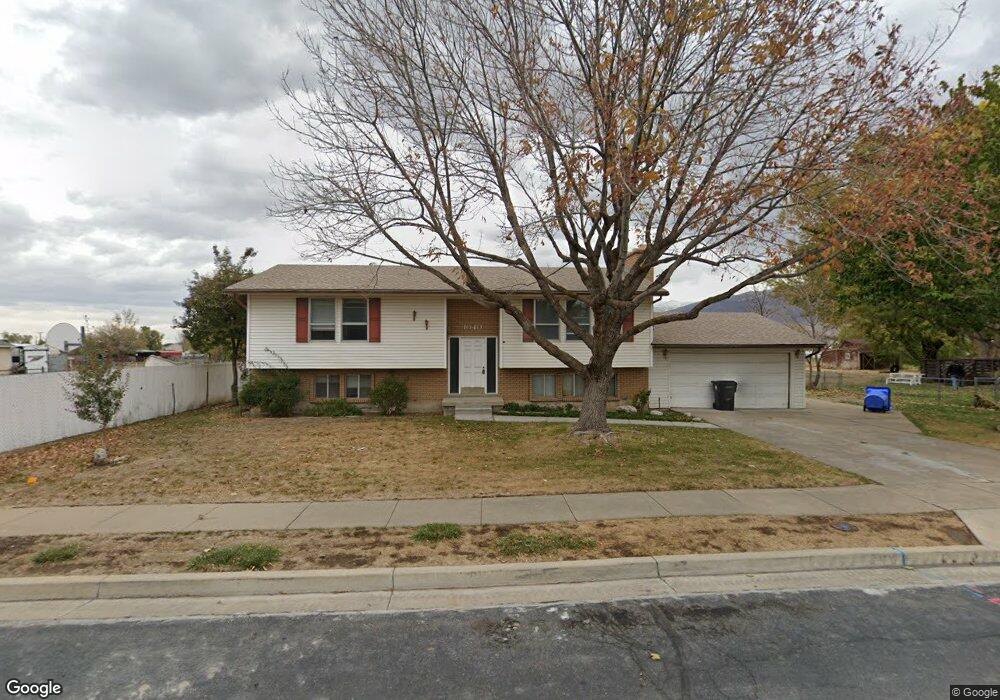
1040 W 200 N West Bountiful, UT 84087
Estimated Value: $515,000 - $547,029
4
Beds
2
Baths
2,332
Sq Ft
$228/Sq Ft
Est. Value
About This Home
This home is located at 1040 W 200 N, West Bountiful, UT 84087 and is currently estimated at $532,007, approximately $228 per square foot. 1040 W 200 N is a home located in Davis County with nearby schools including West Bountiful Elementary School, Bountiful Junior High School, and Viewmont High School.
Ownership History
Date
Name
Owned For
Owner Type
Purchase Details
Closed on
Aug 16, 2012
Sold by
Torman Kyle and Torman Katherine
Bought by
Holly Refining & Marketing Company Woods
Current Estimated Value
Purchase Details
Closed on
Oct 14, 2011
Sold by
Harris Stephen Lance and Haycock Brandi M
Bought by
Torman Kyle and Torman Katherine
Purchase Details
Closed on
Jul 16, 2007
Sold by
Stanger L Dallas and Stanger Sharon T
Bought by
Harris Stephen Lance and Baycock Brandi M
Home Financials for this Owner
Home Financials are based on the most recent Mortgage that was taken out on this home.
Original Mortgage
$222,000
Interest Rate
6.41%
Mortgage Type
New Conventional
Create a Home Valuation Report for This Property
The Home Valuation Report is an in-depth analysis detailing your home's value as well as a comparison with similar homes in the area
Home Values in the Area
Average Home Value in this Area
Purchase History
| Date | Buyer | Sale Price | Title Company |
|---|---|---|---|
| Holly Refining & Marketing Company Woods | -- | First American Title | |
| Torman Kyle | -- | Bonneville Superior | |
| Harris Stephen Lance | -- | Backman Title Services |
Source: Public Records
Mortgage History
| Date | Status | Borrower | Loan Amount |
|---|---|---|---|
| Previous Owner | Harris Stephen Lance | $222,000 |
Source: Public Records
Tax History Compared to Growth
Tax History
| Year | Tax Paid | Tax Assessment Tax Assessment Total Assessment is a certain percentage of the fair market value that is determined by local assessors to be the total taxable value of land and additions on the property. | Land | Improvement |
|---|---|---|---|---|
| 2025 | $3,091 | $268,950 | $135,297 | $133,653 |
| 2024 | $3,061 | $273,899 | $111,128 | $162,771 |
| 2023 | $2,918 | $263,450 | $116,134 | $147,315 |
| 2022 | $2,901 | $484,000 | $182,813 | $301,187 |
| 2021 | $2,509 | $352,000 | $134,296 | $217,704 |
| 2020 | $2,237 | $310,000 | $125,662 | $184,338 |
| 2019 | $2,193 | $301,000 | $127,637 | $173,363 |
| 2018 | $1,951 | $263,000 | $129,136 | $133,864 |
| 2016 | $1,661 | $121,660 | $32,621 | $89,039 |
| 2015 | $1,596 | $111,100 | $32,621 | $78,479 |
| 2014 | $1,565 | $96,250 | $32,621 | $63,629 |
| 2013 | -- | $96,997 | $28,676 | $68,321 |
Source: Public Records
Map
Nearby Homes
- 280 N 1100 W
- 767 W 220 N
- 680 W 500 S Unit 22
- 680 W 500 S Unit 17
- Carson Plan at Amberly Place
- 2050 Farmhouse Plan at Amberly Place
- Pasadena (Inactive) Plan at Amberly Place
- Portland Plan at Amberly Place
- 1067 W Audrey Ln Unit 8
- 1075 W Audrey Ln Unit 6
- 1056 W Audrey Ln Unit 14
- 1064 W Audrey Ln Unit 15
- 1072 W Audrey Ln Unit 17
- 1069 W Linden Ln Unit 31
- 825 W 1320 N
- 340 N 500 W Unit 204
- 758 W 1000 S
- 399 W 400 N Unit 47
- 743 W 1000 S
- 1288 S 1050 W