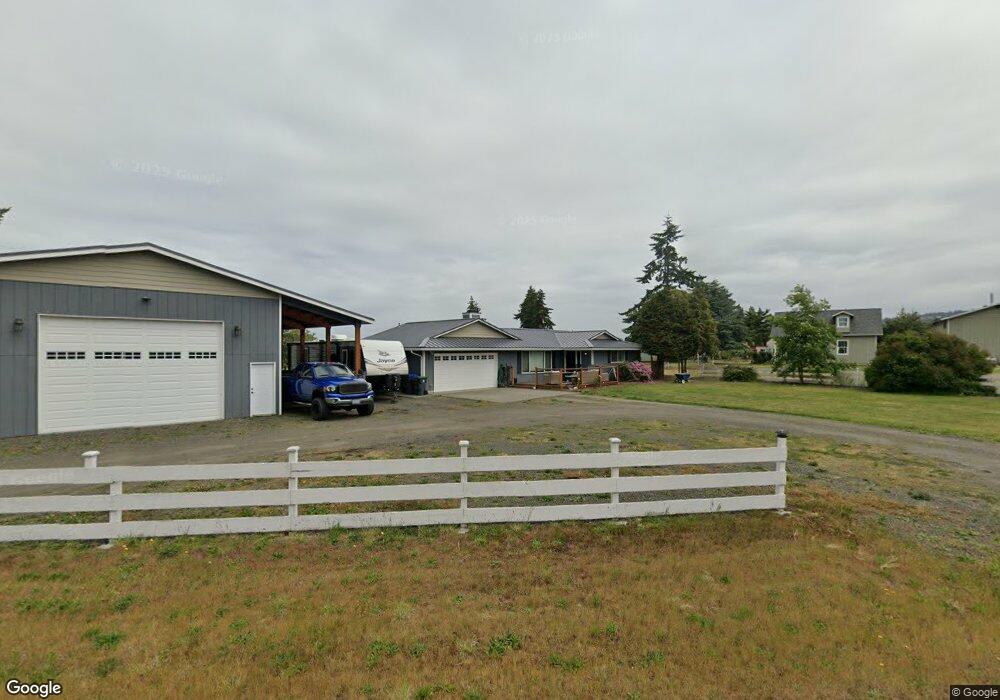
1040 W Oak Ct Sequim, WA 98382
Estimated Value: $498,000 - $576,000
2
Beds
3
Baths
1,308
Sq Ft
$413/Sq Ft
Est. Value
About This Home
This home is located at 1040 W Oak Ct, Sequim, WA 98382 and is currently estimated at $539,702, approximately $412 per square foot. 1040 W Oak Ct is a home located in Clallam County with nearby schools including Greywolf Elementary School, Sequim Middle School, and Sequim Senior High School.
Ownership History
Date
Name
Owned For
Owner Type
Purchase Details
Closed on
Feb 15, 2012
Sold by
Federal National Mortgage Association
Bought by
Priest Justin W and Priest Amber D
Current Estimated Value
Home Financials for this Owner
Home Financials are based on the most recent Mortgage that was taken out on this home.
Original Mortgage
$163,265
Outstanding Balance
$111,692
Interest Rate
3.86%
Mortgage Type
New Conventional
Estimated Equity
$428,010
Purchase Details
Closed on
Apr 6, 2011
Sold by
Sivertsen Kristopher D
Bought by
Federal National Mortgage Association
Purchase Details
Closed on
Oct 15, 2005
Sold by
Cronholm Fredrick C
Bought by
Siversen Kristopher D
Home Financials for this Owner
Home Financials are based on the most recent Mortgage that was taken out on this home.
Original Mortgage
$39,600
Interest Rate
5.9%
Mortgage Type
Credit Line Revolving
Create a Home Valuation Report for This Property
The Home Valuation Report is an in-depth analysis detailing your home's value as well as a comparison with similar homes in the area
Home Values in the Area
Average Home Value in this Area
Purchase History
| Date | Buyer | Sale Price | Title Company |
|---|---|---|---|
| Priest Justin W | $160,000 | Clallam Title Company | |
| Federal National Mortgage Association | $255,622 | Olympic Peninsula Title | |
| Siversen Kristopher D | $198,000 | Olympic Peninsula Title Co |
Source: Public Records
Mortgage History
| Date | Status | Borrower | Loan Amount |
|---|---|---|---|
| Open | Priest Justin W | $163,265 | |
| Previous Owner | Siversen Kristopher D | $39,600 | |
| Previous Owner | Siversen Kristopher D | $158,400 |
Source: Public Records
Tax History Compared to Growth
Tax History
| Year | Tax Paid | Tax Assessment Tax Assessment Total Assessment is a certain percentage of the fair market value that is determined by local assessors to be the total taxable value of land and additions on the property. | Land | Improvement |
|---|---|---|---|---|
| 2021 | $2,683 | $290,714 | $100,000 | $190,714 |
| 2020 | $2,337 | $226,404 | $89,100 | $137,304 |
| 2018 | $2,094 | $210,796 | $89,100 | $121,696 |
| 2017 | $1,753 | $195,952 | $89,100 | $106,852 |
| 2016 | $1,753 | $196,992 | $89,100 | $107,892 |
| 2015 | $1,753 | $166,489 | $89,100 | $77,389 |
| 2013 | $1,753 | $162,802 | $89,100 | $73,702 |
| 2012 | $1,753 | $176,236 | $99,000 | $77,236 |
Source: Public Records
Map
Nearby Homes
- 787 N Kendall Rd
- TBD Wright Rd
- 19 Juniper Mobile Estate
- 110 Jennie's Blvd
- 371 Williamson Rd
- 109 N Honeycomb Cir
- 642 N 7th Ave
- 621 N 7th Ave
- 42 Juniper Mobile Estate
- 50 Juniper Mobile Estate
- NKA N 7th Ave
- 191 Snapdragon Ln
- 669 W Hendrickson Rd Unit 4
- 669 W Hendrickson Rd Unit 7
- 669 W Hendrickson Rd Unit 3
- 669 W Hendrickson Rd Unit 2
- 669 W Hendrickson Rd Unit 7
- 669 W Hendrickson Rd Unit 4
- 669 W Hendrickson Rd Unit 1
- 669 W Hendrickson Rd Unit 5
- 1020 W Oak Ct
- 1050 W Oak Ct
- 991 W Hendrickson Rd
- 1041 W Oak Ct
- 1051 W Oak Ct
- 1031 W Oak Ct
- 942 W Oak Ct
- 1021 W Oak Ct
- 1060 W Hendrickson Rd
- 952 W Oak Ct
- 950 W Oak Ct
- 962 W Oak Ct
- 960 W Oak Ct
- 940 W Oak Ct
- 1020 1040 W Hendrickson Rd
- 1020 W Hendrickson Rd
- 99999 Wright Rd Unit Lot 1
- 99999 Wright Rd Unit Lot 2
- 99999 Wright Rd