
Landlord's Agent in 2024
Jennifer McPherson
Pinkham Real Estate
(603) 986-6987
83 in this area
153 Total Sales
Estimated Value: $448,000 - $561,000
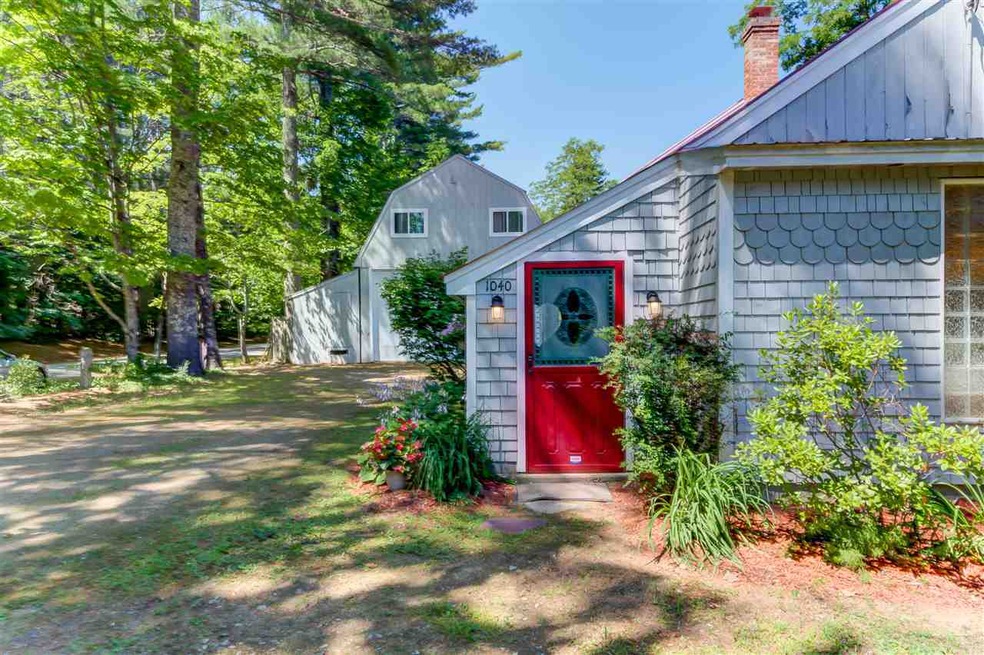
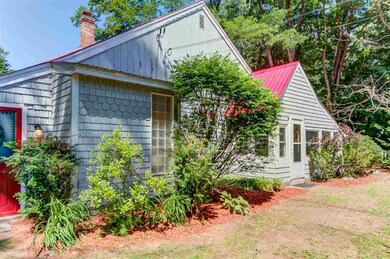
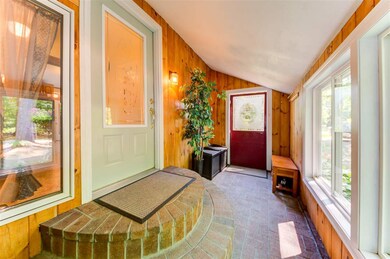
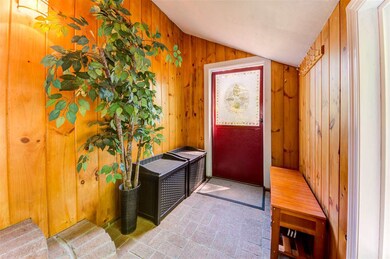
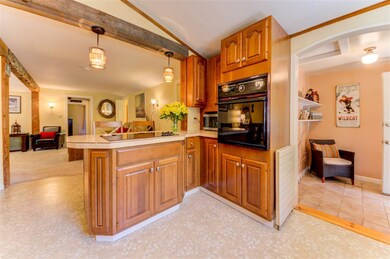
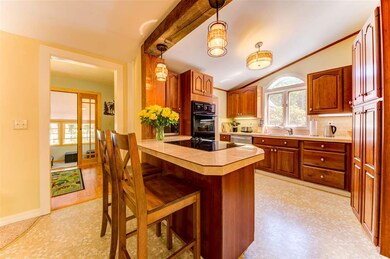
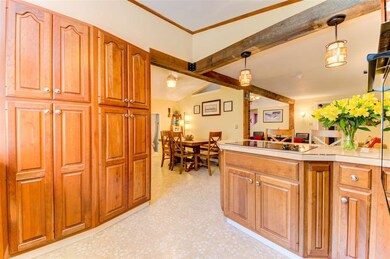
Nestled on the picturesque West Side Road, this delightful 3 bedroom, 2 bath seasonal rental offers the ideal blend of comfort and convenience for your White Mountain escape. Designed with families in mind, this welcoming home provides a serene retreat where you can relax and recharge after a day of adventure. Explore nearby outdoor attractions, enjoy skiing, hiking, or simply take in the natural beauty surrounding you. Walking distance to Marshall Conservation Trail Area. Includes utilities, plowing, and trash pick-up. Available for a minimum of 6 months from November 1st to May 4th, with an option to extend from October 1st to May 30th for an additional fee. Credit/Background check, no smoking.
| Date | Buyer | Sale Price | Title Company |
|---|---|---|---|
| Fitzpatrick Stephen M | $228,000 | -- | |
| Fitzpatrick Stephen M | $228,000 | -- |
| Date | Status | Borrower | Loan Amount |
|---|---|---|---|
| Closed | Fitzpatrick Stephen M | $0 |
| Date | Event | Price | List to Sale | Price per Sq Ft | Prior Sale |
|---|---|---|---|---|---|
| 11/03/2024 11/03/24 | Rented | $14,400 | 0.0% | -- | |
| 08/26/2024 08/26/24 | Under Contract | -- | -- | -- | |
| 08/09/2024 08/09/24 | For Rent | $14,400 | -21.7% | -- | |
| 10/04/2023 10/04/23 | Rented | $18,400 | +22.7% | -- | |
| 09/26/2023 09/26/23 | Price Changed | $15,000 | -10.7% | $7 / Sq Ft | |
| 08/17/2023 08/17/23 | For Rent | $16,800 | -7.7% | -- | |
| 10/08/2022 10/08/22 | Rented | $18,200 | +16.7% | -- | |
| 09/22/2022 09/22/22 | Under Contract | -- | -- | -- | |
| 08/13/2022 08/13/22 | Price Changed | $15,600 | +32.8% | $8 / Sq Ft | |
| 08/04/2022 08/04/22 | Price Changed | $11,750 | -49.8% | $6 / Sq Ft | |
| 07/23/2022 07/23/22 | For Rent | $23,400 | +143.8% | -- | |
| 10/22/2019 10/22/19 | Rented | $9,600 | +500.0% | -- | |
| 09/16/2019 09/16/19 | Under Contract | -- | -- | -- | |
| 08/21/2019 08/21/19 | For Rent | $1,600 | -83.8% | -- | |
| 10/09/2018 10/09/18 | Rented | $9,865 | 0.0% | -- | |
| 08/31/2018 08/31/18 | For Rent | $9,865 | 0.0% | -- | |
| 02/08/2013 02/08/13 | Sold | $228,000 | -6.7% | $113 / Sq Ft | View Prior Sale |
| 12/18/2012 12/18/12 | Pending | -- | -- | -- | |
| 06/28/2012 06/28/12 | For Sale | $244,500 | -- | $121 / Sq Ft |
| Year | Tax Paid | Tax Assessment Tax Assessment Total Assessment is a certain percentage of the fair market value that is determined by local assessors to be the total taxable value of land and additions on the property. | Land | Improvement |
|---|---|---|---|---|
| 2024 | $5,756 | $475,700 | $80,600 | $395,100 |
| 2023 | $5,190 | $475,700 | $80,600 | $395,100 |
| 2022 | $4,605 | $255,000 | $67,400 | $187,600 |
| 2021 | $4,167 | $255,000 | $67,400 | $187,600 |
| 2020 | $4,422 | $255,000 | $67,400 | $187,600 |
| 2019 | $4,417 | $255,000 | $67,400 | $187,600 |
| 2018 | $4,299 | $206,000 | $52,700 | $153,300 |
| 2017 | $4,116 | $206,000 | $52,700 | $153,300 |
| 2016 | $3,978 | $206,000 | $52,700 | $153,300 |
| 2015 | $3,933 | $206,000 | $52,700 | $153,300 |
| 2014 | $3,876 | $205,500 | $52,700 | $152,800 |
| 2013 | $3,735 | $209,100 | $52,700 | $156,400 |
Landlord's Agent in 2024
Jennifer McPherson
Pinkham Real Estate
(603) 986-6987
83 in this area
153 Total Sales
Seller's Agent in 2013
Maureen Garrette
KW Coastal and Lakes & Mountains Realty/N Conway
(603) 986-5606
8 in this area
29 Total Sales
Buyer's Agent in 2013
Greydon Turner
Pinkham Real Estate
(603) 387-6081
150 in this area
293 Total Sales
Source: PrimeMLS
MLS Number: 5009060
APN: 250-101
Disclaimer: Certain information contained herein is derived from information provided by parties other than Homes.com. All information provided is deemed reliable, but is not guaranteed to be accurate and should be independently verified.
![]() Copyright 2025 PrimeMLS, Inc. All rights reserved. This information is deemed reliable, but not guaranteed. The data relating to real estate displayed on this display comes in part from the IDX Program of PrimeMLS. The information being provided is for consumers’ personal, non-commercial use and may not be used for any purpose other than to identify prospective properties consumers may be interested in purchasing.
Copyright 2025 PrimeMLS, Inc. All rights reserved. This information is deemed reliable, but not guaranteed. The data relating to real estate displayed on this display comes in part from the IDX Program of PrimeMLS. The information being provided is for consumers’ personal, non-commercial use and may not be used for any purpose other than to identify prospective properties consumers may be interested in purchasing.