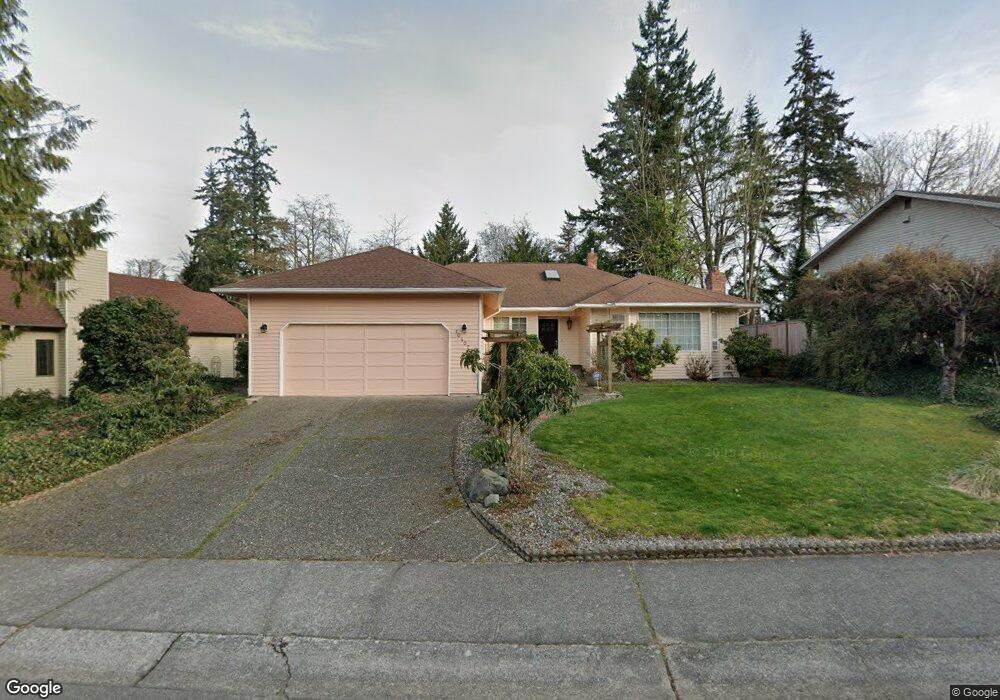
10407 53rd Ave W Mukilteo, WA 98275
Harbour Pointe NeighborhoodEstimated Value: $890,000 - $954,000
3
Beds
2
Baths
2,013
Sq Ft
$456/Sq Ft
Est. Value
About This Home
This home is located at 10407 53rd Ave W, Mukilteo, WA 98275 and is currently estimated at $917,620, approximately $455 per square foot. 10407 53rd Ave W is a home located in Snohomish County with nearby schools including Columbia Elementary School, Harbour Pointe Middle School, and Kamiak High School.
Ownership History
Date
Name
Owned For
Owner Type
Purchase Details
Closed on
Jan 22, 2010
Sold by
Hajarolasvadi Fatemeh
Bought by
Safavi Mehdi
Current Estimated Value
Home Financials for this Owner
Home Financials are based on the most recent Mortgage that was taken out on this home.
Original Mortgage
$351,800
Outstanding Balance
$231,913
Interest Rate
5.03%
Mortgage Type
New Conventional
Estimated Equity
$685,707
Purchase Details
Closed on
Nov 15, 2005
Sold by
Safavi Mastaneh
Bought by
Safavi Mehdi
Home Financials for this Owner
Home Financials are based on the most recent Mortgage that was taken out on this home.
Original Mortgage
$320,000
Interest Rate
5.75%
Mortgage Type
Fannie Mae Freddie Mac
Purchase Details
Closed on
May 1, 2003
Sold by
Mckay Charles W and Mckay Jean P
Bought by
Safavi Mehdi and Safavi Mastanch
Home Financials for this Owner
Home Financials are based on the most recent Mortgage that was taken out on this home.
Original Mortgage
$234,440
Interest Rate
5.12%
Mortgage Type
Purchase Money Mortgage
Create a Home Valuation Report for This Property
The Home Valuation Report is an in-depth analysis detailing your home's value as well as a comparison with similar homes in the area
Home Values in the Area
Average Home Value in this Area
Purchase History
| Date | Buyer | Sale Price | Title Company |
|---|---|---|---|
| Safavi Mehdi | $84,269 | First American | |
| Safavi Mehdi | $11,235 | First American | |
| Safavi Mehdi | $293,050 | Commonwealth Land Title |
Source: Public Records
Mortgage History
| Date | Status | Borrower | Loan Amount |
|---|---|---|---|
| Open | Safavi Mehdi | $351,800 | |
| Closed | Safavi Mehdi | $320,000 | |
| Previous Owner | Safavi Mehdi | $234,440 | |
| Closed | Safavi Mehdi | $58,610 |
Source: Public Records
Tax History Compared to Growth
Tax History
| Year | Tax Paid | Tax Assessment Tax Assessment Total Assessment is a certain percentage of the fair market value that is determined by local assessors to be the total taxable value of land and additions on the property. | Land | Improvement |
|---|---|---|---|---|
| 2025 | $5,765 | $780,100 | $456,000 | $324,100 |
| 2024 | $5,765 | $774,700 | $446,000 | $328,700 |
| 2023 | $5,799 | $804,200 | $433,000 | $371,200 |
| 2022 | $5,252 | $624,800 | $306,000 | $318,800 |
| 2020 | $4,541 | $542,400 | $266,000 | $276,400 |
| 2019 | $4,231 | $515,700 | $241,000 | $274,700 |
| 2018 | $4,464 | $473,000 | $228,000 | $245,000 |
| 2017 | $3,921 | $430,100 | $203,000 | $227,100 |
| 2016 | $3,682 | $401,000 | $180,000 | $221,000 |
| 2015 | $3,705 | $363,400 | $165,000 | $198,400 |
| 2013 | $3,246 | $299,400 | $136,000 | $163,400 |
Source: Public Records
Map
Nearby Homes
- 10122 50th Place W
- 10705 57th Place W
- 10834 53rd Place W
- 11032 55th Ave W
- 5300 Harbour Pointe Blvd Unit 305L
- 5300 Harbour Pointe Blvd Unit 305J
- 5300 Harbour Pointe Blvd Unit 311-I
- 106 Xx MacArthur Ln
- 5400 Harbour Pointe Blvd Unit F 201
- 5500 Harbour Pointe Blvd Unit B203
- 9716 58th Place W
- 10961 Villa Monte Ct Unit 10961
- 11017 Villa Rosa Ln Unit 11017
- 10121 64th Place W
- 5912 96th St SW
- 10413 66th Place W
- 9804 Marine View Dr
- 11801 Harbour Pointe Blvd Unit 203
- 11629 E Oakmont Dr
- 5705 92nd St SW
- 10401 53rd Ave W
- 10413 53rd Ave W
- 10333 53rd Ave W
- 10427 53rd Ave W
- 10406 53rd Ave W
- 10412 53rd Ave W
- 10323 53rd Ave W
- 10431 53rd Ave W
- 5414 104th Place SW
- 5403 104th Place SW
- 10426 53rd Ave W
- 5308 104th St SW
- 5413 104th Place SW
- 10509 53rd Ave W
- 10430 53rd Ave W
- 5426 104th Place SW
- 5616 104th Place SW
- 5620 104th Place SW
- 10502 53rd Ave W
- 5415 104th Place SW