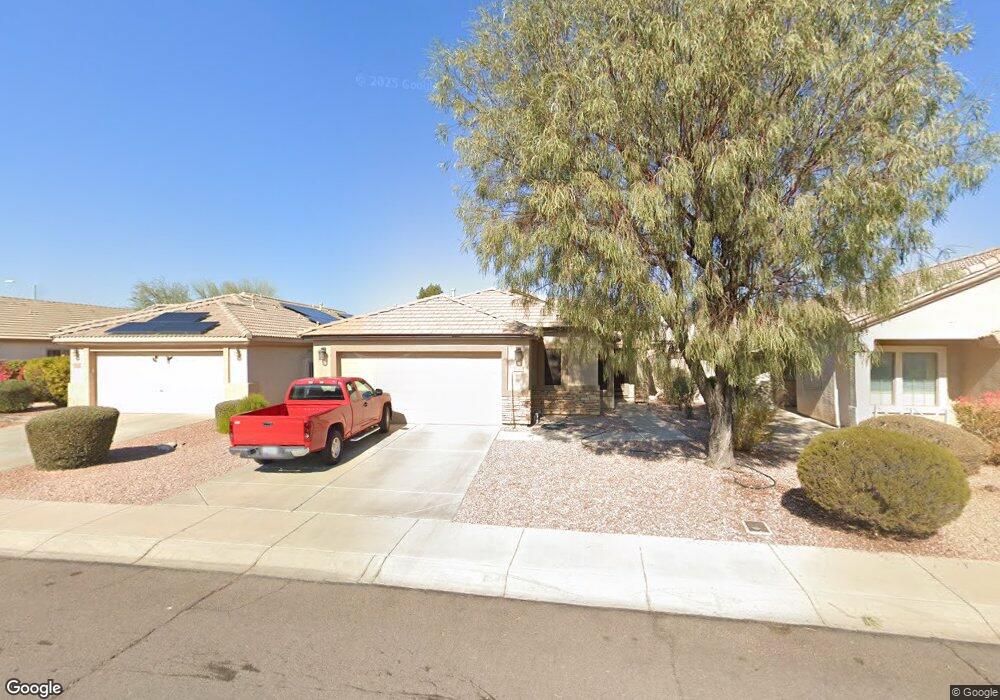
10408 W Runion Dr Peoria, AZ 85382
Estimated Value: $339,293 - $394,000
3
Beds
2
Baths
1,548
Sq Ft
$239/Sq Ft
Est. Value
About This Home
This home is located at 10408 W Runion Dr, Peoria, AZ 85382 and is currently estimated at $369,323, approximately $238 per square foot. 10408 W Runion Dr is a home located in Maricopa County with nearby schools including Parkridge Elementary School, Sunrise Mountain High School, and Candeo Peoria.
Ownership History
Date
Name
Owned For
Owner Type
Purchase Details
Closed on
Aug 9, 2016
Sold by
Greeb Robert H and Greeb Vickie S
Bought by
Greeb Robert H and Greeb Vickie S
Current Estimated Value
Purchase Details
Closed on
Oct 8, 2004
Sold by
Gomez Carol M
Bought by
Greeb Robert H and Greeb Vickie S
Home Financials for this Owner
Home Financials are based on the most recent Mortgage that was taken out on this home.
Original Mortgage
$131,900
Outstanding Balance
$65,542
Interest Rate
5.82%
Mortgage Type
New Conventional
Estimated Equity
$303,781
Purchase Details
Closed on
Jul 17, 2002
Sold by
Hartwig Elmer W and Elmer W Hartwig Trust
Bought by
Gomez Felix and Gomez Carol M
Home Financials for this Owner
Home Financials are based on the most recent Mortgage that was taken out on this home.
Original Mortgage
$95,900
Interest Rate
8.5%
Mortgage Type
New Conventional
Purchase Details
Closed on
May 10, 2000
Sold by
Greystone Homes Inc
Bought by
Hartwig Elmer W
Create a Home Valuation Report for This Property
The Home Valuation Report is an in-depth analysis detailing your home's value as well as a comparison with similar homes in the area
Home Values in the Area
Average Home Value in this Area
Purchase History
| Date | Buyer | Sale Price | Title Company |
|---|---|---|---|
| Greeb Robert H | -- | None Available | |
| Greeb Robert H | $164,900 | First American Title Ins Co | |
| Gomez Felix | $137,000 | Security Title Agency | |
| Hartwig Elmer W | $135,599 | North American Title |
Source: Public Records
Mortgage History
| Date | Status | Borrower | Loan Amount |
|---|---|---|---|
| Open | Greeb Robert H | $131,900 | |
| Previous Owner | Gomez Felix | $95,900 |
Source: Public Records
Tax History Compared to Growth
Tax History
| Year | Tax Paid | Tax Assessment Tax Assessment Total Assessment is a certain percentage of the fair market value that is determined by local assessors to be the total taxable value of land and additions on the property. | Land | Improvement |
|---|---|---|---|---|
| 2025 | $1,562 | $19,378 | -- | -- |
| 2024 | $1,532 | $18,455 | -- | -- |
| 2023 | $1,532 | $28,020 | $5,600 | $22,420 |
| 2022 | $1,500 | $22,070 | $4,410 | $17,660 |
| 2021 | $1,597 | $21,080 | $4,210 | $16,870 |
| 2020 | $1,641 | $18,800 | $3,760 | $15,040 |
| 2019 | $1,582 | $17,850 | $3,570 | $14,280 |
| 2018 | $1,506 | $17,000 | $3,400 | $13,600 |
| 2017 | $1,509 | $14,910 | $2,980 | $11,930 |
| 2016 | $1,491 | $14,720 | $2,940 | $11,780 |
| 2015 | $1,393 | $13,980 | $2,790 | $11,190 |
Source: Public Records
Map
Nearby Homes
- 10347 W Mohawk Ln
- 10379 W Tonopah Dr
- 20274 N 104th Ave
- 20615 N 105th Ave
- 10344 W Burnett Rd
- 20017 N 101st Ave
- 20670 N 105th Dr
- 10630 W Mohawk Ln
- 10528 W Potter Dr
- 10368 W Ross Ave
- 20046 N Welk Dr
- 20037 N Welk Dr
- 20360 N 106th Ln
- 10659 W Yukon Dr
- 19845 N Welk Dr
- 19835 N 100th Dr
- 10134 W Pine Springs Dr
- 20769 N 106th Ln
- 10169 W Potter Dr
- 20018 N Lakeforest Dr
- 10412 W Runion Dr
- 10404 W Runion Dr
- 10416 W Runion Dr
- 10381 W Mohawk Ln
- 10367 W Mohawk Ln
- 10385 W Mohawk Ln
- 10389 W Mohawk Ln
- 10363 W Mohawk Ln
- 10394 W Runion Dr
- 10401 W Mohawk Ln
- 10359 W Mohawk Ln
- 10405 W Mohawk Ln
- 10355 W Mohawk Ln
- 10407 W Runion Dr
- 10399 W Runion Dr
- 10390 W Runion Dr
- 10411 W Runion Dr
- 10351 W Mohawk Ln
- 10395 W Runion Dr