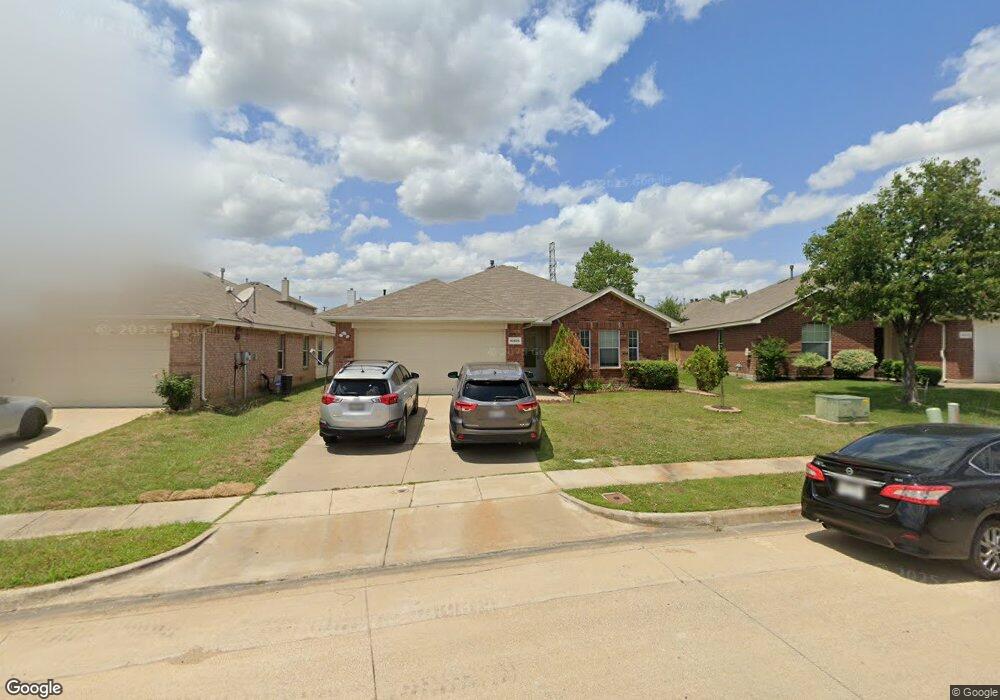
10409 Lake Bend Trail Hurst, TX 76053
Mosier Valley NeighborhoodEstimated Value: $372,515 - $415,000
3
Beds
2
Baths
1,774
Sq Ft
$219/Sq Ft
Est. Value
About This Home
This home is located at 10409 Lake Bend Trail, Hurst, TX 76053 and is currently estimated at $389,129, approximately $219 per square foot. 10409 Lake Bend Trail is a home located in Tarrant County with nearby schools including West Hurst Elementary School, Hurst J High School, and L.D. Bell High School.
Ownership History
Date
Name
Owned For
Owner Type
Purchase Details
Closed on
Jan 11, 2018
Sold by
Opendoor Homes Phonex 2 Llc
Bought by
Dhami Gagan K Kc and Karki Rita
Current Estimated Value
Home Financials for this Owner
Home Financials are based on the most recent Mortgage that was taken out on this home.
Original Mortgage
$227,950
Outstanding Balance
$192,166
Interest Rate
3.9%
Mortgage Type
New Conventional
Estimated Equity
$196,963
Purchase Details
Closed on
Aug 31, 2017
Sold by
Khan Mansoor A and Khan Nasira
Bought by
Opendoor Homes Phoenix 2 Llc
Purchase Details
Closed on
Feb 25, 2003
Sold by
Lennar Homes Of Texas Inc
Bought by
Khan Mansoor A and Khan Nasira
Home Financials for this Owner
Home Financials are based on the most recent Mortgage that was taken out on this home.
Original Mortgage
$135,118
Interest Rate
5.86%
Mortgage Type
FHA
Create a Home Valuation Report for This Property
The Home Valuation Report is an in-depth analysis detailing your home's value as well as a comparison with similar homes in the area
Home Values in the Area
Average Home Value in this Area
Purchase History
| Date | Buyer | Sale Price | Title Company |
|---|---|---|---|
| Dhami Gagan K Kc | -- | Fidelity National Title | |
| Opendoor Homes Phoenix 2 Llc | -- | Fidelity National Title | |
| Khan Mansoor A | -- | North American Title |
Source: Public Records
Mortgage History
| Date | Status | Borrower | Loan Amount |
|---|---|---|---|
| Open | Dhami Gagan K Kc | $227,950 | |
| Previous Owner | Khan Mansoor A | $135,118 | |
| Closed | Opendoor Homes Phoenix 2 Llc | $0 |
Source: Public Records
Tax History Compared to Growth
Tax History
| Year | Tax Paid | Tax Assessment Tax Assessment Total Assessment is a certain percentage of the fair market value that is determined by local assessors to be the total taxable value of land and additions on the property. | Land | Improvement |
|---|---|---|---|---|
| 2025 | $7,772 | $361,438 | $80,000 | $281,438 |
| 2024 | $7,772 | $361,438 | $80,000 | $281,438 |
| 2023 | $7,484 | $352,782 | $50,000 | $302,782 |
| 2022 | $7,072 | $291,308 | $50,000 | $241,308 |
| 2021 | $6,185 | $241,341 | $50,000 | $191,341 |
| 2020 | $6,262 | $242,249 | $50,000 | $192,249 |
| 2019 | $6,606 | $247,231 | $50,000 | $197,231 |
| 2018 | $5,715 | $213,886 | $24,000 | $189,886 |
| 2017 | $5,154 | $194,774 | $24,000 | $170,774 |
| 2016 | $4,685 | $190,011 | $24,000 | $166,011 |
| 2015 | $3,621 | $152,274 | $24,000 | $128,274 |
| 2014 | $3,621 | $143,200 | $24,000 | $119,200 |
Source: Public Records
Map
Nearby Homes
- 10401 Lake Park Dr
- 3905 Shady Creek Dr
- 3216 Jetranger Rd
- 812 Forest Hollow Dr
- 1309 Driftwood Dr
- 1501 Woodridge Cir
- 1407 Woodridge Cir
- 1302 Woodridge Cir
- 1200 Tanglewood Trail
- 11206 Falling Leaf Ln Unit 335
- 909 Dee Ln
- 712 Brookfield Dr
- 3624 Frazier Ct
- 11111 Loblolly Ln
- 1604 Richmond Dr
- 3205 Wooded Glen Way Unit 164
- 2 Linderhof Cir
- 11103 Loblolly Ln Unit 271
- 804 Natchez Ave
- 720 Tanglewood Dr
- 10405 Lake Bend Trail
- 10413 Lake Bend Trail
- 10401 Lake Bend Trail
- 10417 Lake Bend Trail
- 10408 Devin Ln
- 10404 Devin Ln
- 10412 Devin Ln
- 10400 Devin Ln
- 10416 Devin Ln
- 10421 Lake Bend Trail
- 10412 Lake Bend Trail
- 10420 Devin Ln
- 10400 Lake Bend Trail
- 10329 Lake Bend Trail
- 10425 Lake Bend Trail
- 10424 Devin Ln
- 10420 Lake Bend Trail
- 10340 Devin Ln
- 10428 Devin Ln
- 10325 Lake Bend Trail