10409 Turning Leaf Ave Las Vegas, NV 89129
Lone Mountain NeighborhoodEstimated Value: $367,578 - $401,000
2
Beds
3
Baths
1,499
Sq Ft
$259/Sq Ft
Est. Value
About This Home
This home is located at 10409 Turning Leaf Ave, Las Vegas, NV 89129 and is currently estimated at $388,895, approximately $259 per square foot. 10409 Turning Leaf Ave is a home located in Clark County with nearby schools including Eileen Conners Elementary School, Justice Myron E Leavitt Middle School, and Centennial High School.
Ownership History
Date
Name
Owned For
Owner Type
Purchase Details
Closed on
Aug 31, 2021
Sold by
Korten Nancy Sue
Bought by
Nancy Korten Revocable Living Trust
Current Estimated Value
Purchase Details
Closed on
Jan 17, 2001
Sold by
Sutton Michael D and Sutton Donald F
Bought by
Korten Nancy S
Home Financials for this Owner
Home Financials are based on the most recent Mortgage that was taken out on this home.
Original Mortgage
$121,500
Interest Rate
7.54%
Purchase Details
Closed on
Jul 19, 1999
Sold by
Bilt Perma
Bought by
Sutton Michael D and Sutton Donald F
Home Financials for this Owner
Home Financials are based on the most recent Mortgage that was taken out on this home.
Original Mortgage
$122,490
Interest Rate
7.4%
Mortgage Type
FHA
Create a Home Valuation Report for This Property
The Home Valuation Report is an in-depth analysis detailing your home's value as well as a comparison with similar homes in the area
Home Values in the Area
Average Home Value in this Area
Purchase History
| Date | Buyer | Sale Price | Title Company |
|---|---|---|---|
| Nancy Korten Revocable Living Trust | -- | -- | |
| Korten Nancy S | $135,000 | First American Title Co | |
| Sutton Michael D | $129,000 | Land Title |
Source: Public Records
Mortgage History
| Date | Status | Borrower | Loan Amount |
|---|---|---|---|
| Previous Owner | Korten Nancy S | $121,500 | |
| Previous Owner | Sutton Michael D | $122,490 |
Source: Public Records
Tax History Compared to Growth
Tax History
| Year | Tax Paid | Tax Assessment Tax Assessment Total Assessment is a certain percentage of the fair market value that is determined by local assessors to be the total taxable value of land and additions on the property. | Land | Improvement |
|---|---|---|---|---|
| 2025 | $1,467 | $86,128 | $31,500 | $54,628 |
| 2024 | $1,425 | $86,128 | $31,500 | $54,628 |
| 2023 | $1,425 | $81,478 | $29,750 | $51,728 |
| 2022 | $1,516 | $70,086 | $22,750 | $47,336 |
| 2021 | $1,404 | $66,475 | $21,350 | $45,125 |
| 2020 | $1,301 | $66,111 | $21,350 | $44,761 |
| 2019 | $1,219 | $61,580 | $17,500 | $44,080 |
| 2018 | $1,163 | $57,003 | $14,700 | $42,303 |
| 2017 | $1,807 | $54,705 | $12,250 | $42,455 |
| 2016 | $1,090 | $52,664 | $10,150 | $42,514 |
| 2015 | $1,087 | $40,987 | $7,000 | $33,987 |
| 2014 | $1,055 | $31,984 | $5,250 | $26,734 |
Source: Public Records
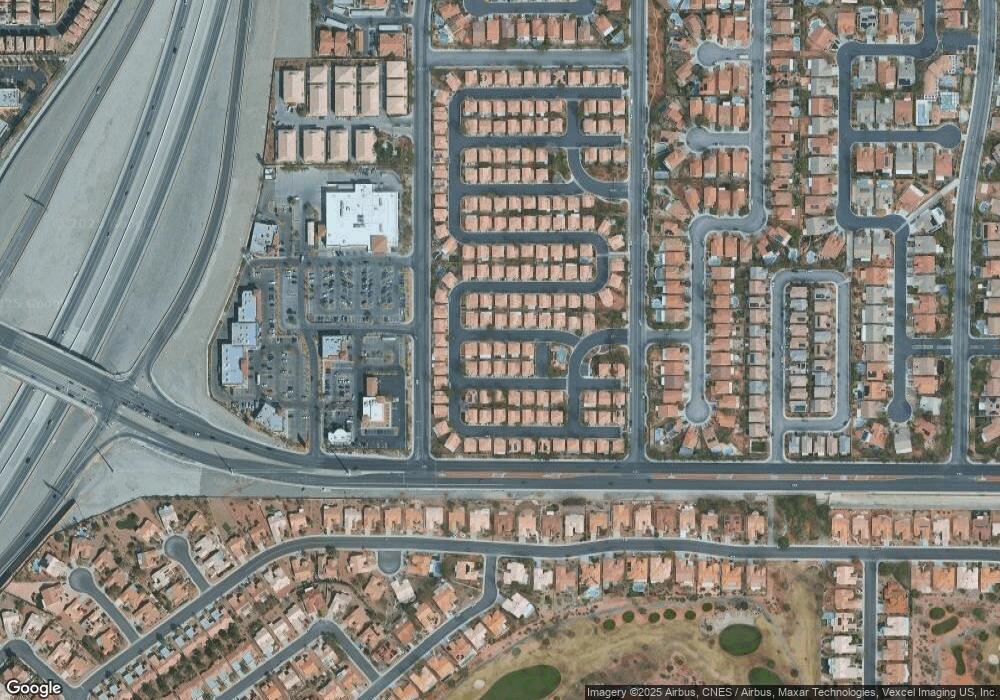
Map
Nearby Homes
- 10401 Turning Leaf Ave
- 10405 Nutt Creek Ave
- 3317 Autumn Veil St
- 10428 Villa Ridge Dr
- 3337 Autumn Veil St
- 10408 Natural Springs Ave
- 10505 Linden Wood Ct
- 3337 Teal Sunset St
- 3412 Crystal Tower St Unit 2
- 10217 Crystal Cloud Ave
- 3028 Treesdale Dr
- 3032 Highland Falls Dr
- 3013 Abercorn Dr
- 10516 Cold Mountain Ave
- 2913 Laverton Dr
- 10321 Junction Hill Dr
- 10372 Pink Cloud Ct
- 10516 Table Lands Ct
- 10100 Folsom Dr
- 3354 Indian Shadow St Unit 203
- 10413 Turning Leaf Ave
- 10405 Turning Leaf Ave
- 10408 Sunny Ranch Ave
- 10412 Sunny Ranch Ave
- 10404 Sunny Ranch Ave
- 10417 Turning Leaf Ave
- 10408 Turning Leaf Ave
- 10412 Turning Leaf Ave
- 10400 Sunny Ranch Ave
- 10404 Turning Leaf Ave
- 10416 Sunny Ranch Ave
- 10400 Turning Leaf Ave
- 10416 Turning Leaf Ave
- 10409 Sunny Ranch Ave
- 10409 Bent Willow Ave
- 10413 Sunny Ranch Ave
- 10413 Bent Willow Ave
- 10405 Sunny Ranch Ave
- 10405 Bent Willow Ave
- 10372 Turning Leaf Ave