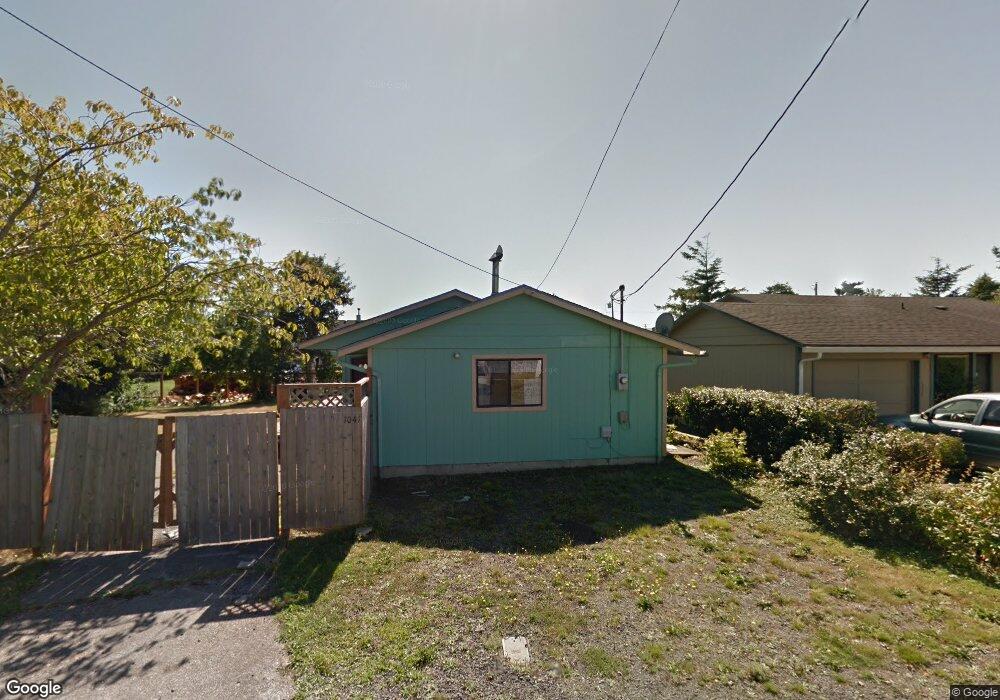
1041 4th Ave Seaside, OR 97138
Estimated Value: $409,000 - $508,000
5
Beds
2
Baths
1,556
Sq Ft
$290/Sq Ft
Est. Value
About This Home
This home is located at 1041 4th Ave, Seaside, OR 97138 and is currently estimated at $451,276, approximately $290 per square foot. 1041 4th Ave is a home located in Clatsop County with nearby schools including Seaside High School.
Ownership History
Date
Name
Owned For
Owner Type
Purchase Details
Closed on
Jun 28, 2021
Sold by
Ricahrdson Megan and Ricahrdson Robert
Bought by
Richardson Megan
Current Estimated Value
Home Financials for this Owner
Home Financials are based on the most recent Mortgage that was taken out on this home.
Original Mortgage
$245,450
Outstanding Balance
$221,740
Interest Rate
2.9%
Mortgage Type
New Conventional
Estimated Equity
$229,536
Purchase Details
Closed on
Jan 24, 2019
Sold by
Murray Barbara
Bought by
Richardson Megan and Richardson Robert
Home Financials for this Owner
Home Financials are based on the most recent Mortgage that was taken out on this home.
Original Mortgage
$240,300
Interest Rate
4.6%
Mortgage Type
New Conventional
Purchase Details
Closed on
Aug 14, 2015
Sold by
Fregoso Sandra and Mccormack Chris
Bought by
Federal National Mortgage Association
Purchase Details
Closed on
Jan 13, 2015
Sold by
Fannie Mae
Bought by
Murray Barbara
Create a Home Valuation Report for This Property
The Home Valuation Report is an in-depth analysis detailing your home's value as well as a comparison with similar homes in the area
Purchase History
| Date | Buyer | Sale Price | Title Company |
|---|---|---|---|
| Richardson Megan | -- | Amrock | |
| Richardson Megan | $270,000 | Ticor Title | |
| Federal National Mortgage Association | $226,748 | Pacific Title Company | |
| Murray Barbara | $141,589 | Pacific Title Company |
Source: Public Records
Mortgage History
| Date | Status | Borrower | Loan Amount |
|---|---|---|---|
| Open | Richardson Megan | $245,450 | |
| Closed | Richardson Megan | $240,300 |
Source: Public Records
Tax History
| Year | Tax Paid | Tax Assessment Tax Assessment Total Assessment is a certain percentage of the fair market value that is determined by local assessors to be the total taxable value of land and additions on the property. | Land | Improvement |
|---|---|---|---|---|
| 2025 | $2,873 | $199,958 | -- | -- |
| 2024 | $2,789 | $194,135 | -- | -- |
| 2023 | $2,706 | $188,482 | $0 | $0 |
| 2022 | $2,633 | $182,994 | $0 | $0 |
| 2021 | $2,577 | $177,665 | $0 | $0 |
| 2020 | $2,517 | $172,491 | $0 | $0 |
| 2019 | $2,448 | $167,468 | $0 | $0 |
Source: Public Records
Map
Nearby Homes
- 1110 6th Ave
- 1299 6th Ave
- 911 1st Ave
- 321 N Holladay Dr
- 815 N King St
- 830 Oceanway St
- 1255 Avenue A Unit 1 and 2
- 1255 Avenue A
- 285 S Lincoln St
- 1000 N Holladay Dr
- 1000 N Holladay Dr Unit 304
- 1269 Avenue D
- 1265 Avenue D
- 423 N Downing St
- 908-910 N Franklin St
- 1350 13th Ave
- 0 N Wahanna Rd
- 1659 Whispering Pines Dr
- 245 12th Ave
- 720 Avenue G
Your Personal Tour Guide
Ask me questions while you tour the home.